A small apparel shop repeatedly runs out of popular leggings while overordering slow-moving seasonal colors. AI inventory forecasting tools estimate likely future demand using sales history, seasonality, stock availability, promotions, and sometimes external signals. A useful forecast must support a reorder decision, not just present an attractive chart. This is about operational forecasting and replenishment choices, separate from general data analysis or broad business transformation. Quantitative examples below are hypothetical and should be adapted to the reader’s actual data.
Key Takeaways
Inventory forecasting estimates future demand under uncertainty; a suggested order quantity is a business decision, not a fact.
Historical sales can understate demand when stockouts prevent customers from buying the product.
Separate seasonal spikes, promotions, lead times, safety stock, and new-product launches before interpreting model outputs.
Evaluate forecast error together with actual stockouts, excess inventory, and cash tied up in slow items.
A forecast should support practical replenishment choices rather than claim impossible precision about next month’s orders.
What Inventory Forecasting Actually Predicts
Inventory forecasting estimates future demand or other stock-related quantities using available information. An AI tool may detect patterns across sales history, promotions, price changes, seasonality, or other factors. The business goal is not to produce an impressive prediction chart. It is to make better decisions about how much to reorder, when to order it, and where uncertainty could cause lost sales or excess stock.
Demand is not the same as past sales. A product may have sold only five units last week because the store ran out after five purchases, while more customers would have bought it if stock had been available. Forecasting directly from sales without accounting for stockouts can underestimate demand and reinforce shortages. Likewise, a promotion-driven spike should not automatically be treated as the new normal.
Forecasting Methods at Different Levels of Complexity
A small business can start with a moving average or seasonal comparison. If a product sells consistently, last month’s or last season’s pattern may be a reasonable baseline. A more advanced forecasting system might model trends, holidays, price changes, sales channels, and correlations among products. Machine learning can be helpful when there is enough reliable data to learn those relationships, but it can overfit small or inconsistent histories.
Forecasts may be expressed as a point estimate, such as 100 units next week, or as a range reflecting uncertainty. The range is especially useful for replenishment. Ordering exactly 100 units may be reasonable with short supplier lead times and cheap emergency restocking, but dangerous with a long import cycle and unpredictable demand. Good planning separates expected demand from risk tolerance.
A forecast should also define its horizon. Next-day staff scheduling, four-week purchase orders, and annual warehouse planning require different aggregation, accuracy measures, and inputs. A model that performs well on weekly totals may not distribute demand accurately across individual stores or product colors.
Understand the Data Before Using AI
At minimum, collect product identifiers, sales quantities, dates, locations, stock availability, and supplier lead times. Promotions, returns, price changes, holidays, and replenishment events may explain otherwise confusing patterns. Keep a consistent unit system: units sold, cases ordered, and kilograms delivered cannot be combined without documented conversions.
Clean item identifiers carefully. A product renamed in the point-of-sale system may appear to have no history, while a replacement SKU may inherit an old item’s demand incorrectly. Returns should not always be treated as negative demand because the operational interpretation depends on whether the returned inventory can be resold. Record cancelled orders separately when appropriate.
Historical stockouts matter. If a store was out of inventory for several days, those days should not be treated as ordinary low-demand observations. A forecast pipeline may need an indicator or an adjusted demand estimate, with uncertainty recorded. When that adjustment is weakly supported, planners should see the limitation rather than receiving a confident single figure.
A Practical Reorder Point Example
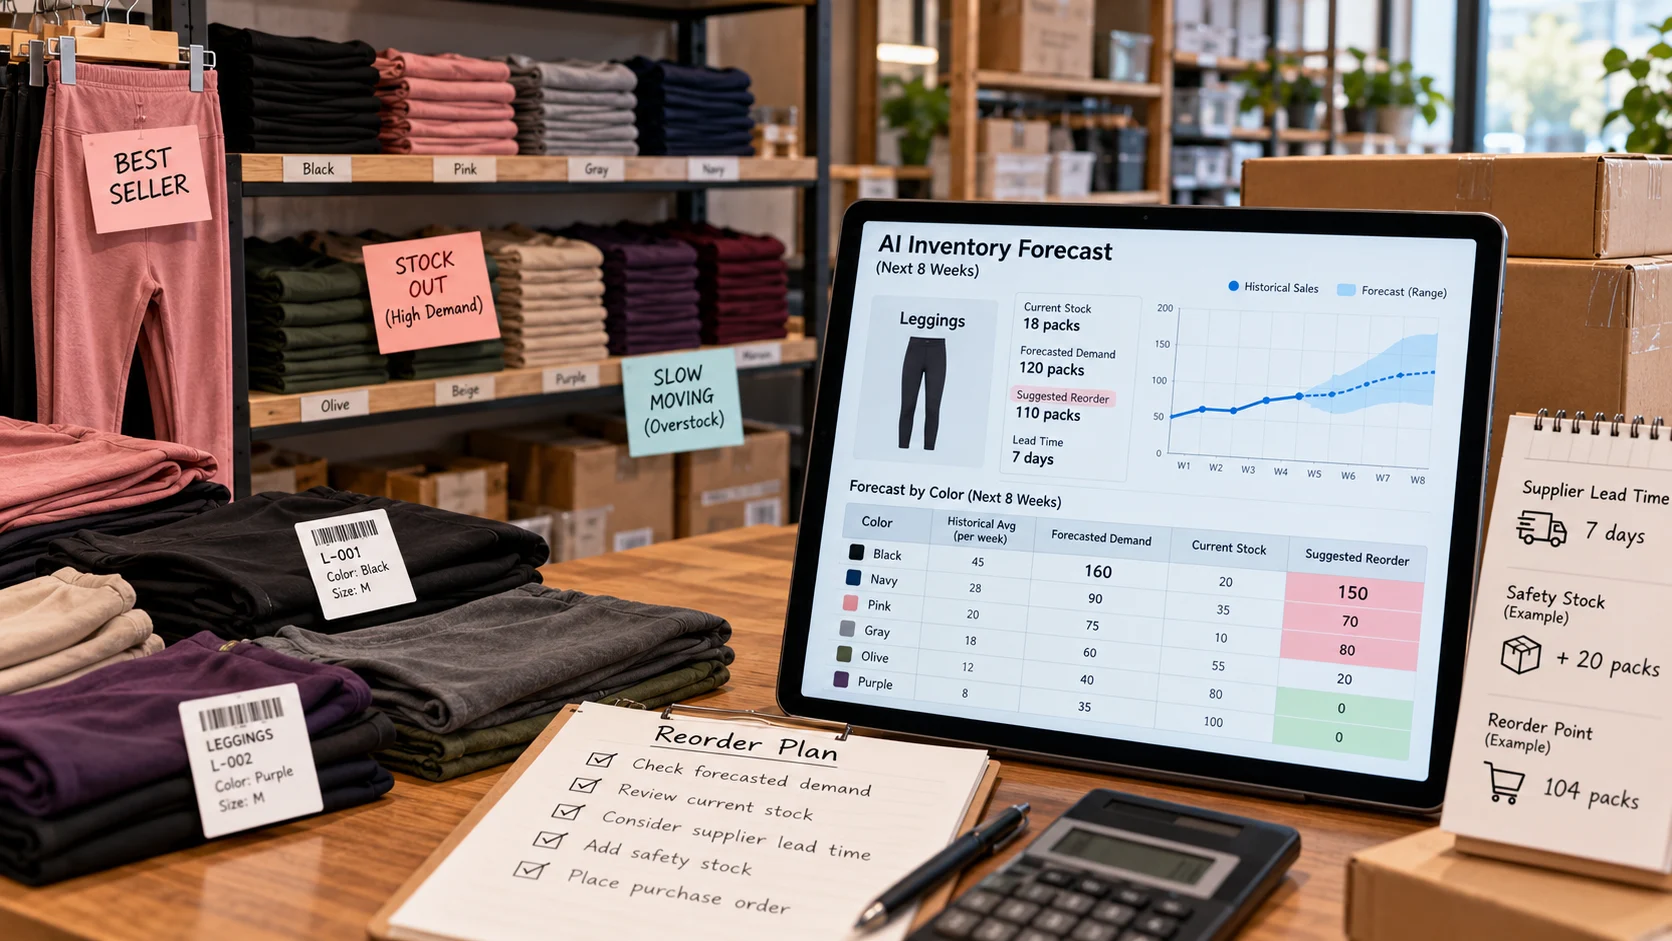
Suppose a neighborhood store sells an average of 12 packs of a product per day, and the supplier normally takes seven days to deliver. A simple expected lead-time demand is 12 × 7 = 84 packs. If the store holds an additional 20 packs as a chosen buffer, a basic reorder point is 104 packs. This is a hypothetical teaching example, not a statistical recommendation for real inventory.
The calculation depends on several assumptions. Daily demand may vary; the supplier could be late; holiday demand could rise; and the store may already have units on order. A realistic inventory position is commonly calculated using on-hand stock plus incoming stock minus commitments or backorders, according to the company’s system. Reordering simply when shelf stock drops below 104 could generate duplicate orders if pending deliveries are ignored.
Safety stock should relate to uncertainty and the cost of shortages versus holding inventory. A perishable food item and a high-value spare part require different policies. A forecasting tool can estimate distributions, but a business owner must still choose service targets and financial limits.
A Step-by-Step Forecasting Pilot
Select a manageable product group. Start with a few items whose sales and stock records are relatively reliable. Avoid judging success from only fast-moving popular products.
State the decision. Decide whether forecasts will change weekly purchase quantities, reorder alerts, or supplier planning. Specify the lead time and planning horizon.
Establish a naive baseline. Compare the proposed model with a moving average, last-period demand, or a simple seasonal reference. Complexity needs to earn its place.
Create time-based evaluation splits. Train on older observations and test on later periods; randomly shuffling a sales time series can leak future information into training.
Assess both forecast error and business consequences. Compare forecasts with subsequent demand while accounting for stockouts, holding costs, waste, and missed sales.
Include operational constraints. Apply pack sizes, minimum order quantities, shelf life, storage capacity, and supplier limits. A mathematically ideal quantity may be impossible to purchase.
Review suggested orders before automating. Staff should be able to see the basis for recommendations and override them for known events or unusual conditions.
Monitor drift and feedback loops. New competitors, pricing changes, and altered supplier performance can invalidate old demand relationships.
A staged trial might run proposed purchase orders in “shadow mode”: the system calculates them but staff continue using established rules. This allows comparison without immediately risking stock availability. Once results are understood, a limited live pilot can test whether the forecast improves actual operational outcomes.
How to Measure Forecast Quality
Metrics such as mean absolute error measure average deviation in units, while percentage-based metrics need care around products with very low or zero demand. A model can obtain attractive overall error by focusing on high-volume items and neglecting slow-moving but essential spare parts. Evaluate results by item group, store, season, and business importance.
Inventory outcomes include stockout frequency, fill rate, excess inventory, spoilage, emergency replenishment cost, and cash tied up in stock. Those numbers can move for reasons unrelated to forecasting—for example, a supplier strike or a changed reorder policy—so conclusions should consider confounding operational changes.
Do not reward a model for always ordering more. It may avoid some stockouts while increasing waste and working-capital needs. The best policy balances service, cost, freshness, and risk according to the particular business.
Tool Selection and Integration Questions
A small business comparing AI inventory tools should ask whether the system imports data from its existing point-of-sale and inventory platforms, handles stockouts, supports new products with little history, expresses uncertainty, and respects minimum order quantities. It should also check whether forecast reasoning and overrides are visible to staff.
Demand-planning services vary widely in cost and capability. Avoid publishing a fixed vendor ranking without current product testing. Instead, use a representative trial file and request evidence for the exact product category and horizon. A useful interface that cannot reconcile actual purchase orders with inventory positions may create operational confusion.
Edge Cases That Need Human Judgment
A newly introduced product lacks history; a closely related product may provide an approximate analogy, but substitution effects can be misleading. An intermittent-demand spare part may require different models than a popular grocery item. Promotions can temporarily increase sales or shift demand between sizes. Weather-driven patterns depend on local conditions and can change abruptly.
Inventory data may also be commercially sensitive. Check access controls and external data transfer before uploading supplier prices or customer-linked order records. Forecasting should use necessary fields only, with retention rules and clear ownership for purchased software.
AI inventory forecasting becomes valuable when uncertain estimates lead to better replenishment decisions. Start with clean availability records, compare against a simple baseline, test the actual reorder process, and make exceptions visible rather than chasing a single model-accuracy score.
Calculating a reorder point for children’s leggings
Suppose a store sells an illustrative average of 12 units of one legging style per week. The supplier normally takes two weeks to replenish inventory, so expected demand over lead time is 24 units. If the store chooses an illustrative safety stock of eight units, its simple reorder point is 32 units. This is an arithmetic planning example, not an optimized inventory policy. A promotion, late shipment, or stockout could make 12 units per week a poor estimate of underlying demand.
Before applying any AI forecast, the retailer should compare it with naive baselines such as last week’s sales or a seasonal average. A rolling-origin backtest uses only information available before each forecast date. Evaluate forecasts and actual replenishment outcomes together: a low error score is not useful if popular sizes remain unavailable.
What the example teaches. A best-selling legging size shows near-zero sales during weeks when it was unavailable. If the model interprets those weeks as low demand, its next reorder becomes too small. The team marks stockout periods and checks forecasts against replenishment decisions instead of raw sales alone.
Handling Promotions, Holidays, and New Products
Forecasting systems should distinguish ordinary demand patterns from planned interventions. A two-week discount may increase sales during the promotion while reducing purchases immediately afterward as customers stock up. Simply averaging the promotional spike into future weeks can result in over-ordering. Keep campaign calendars and price changes available to the forecasting process, and compare promotional performance with an appropriate baseline rather than assuming the entire change was caused by the discount.
Holiday effects differ by product and location. A school-supplies shop may experience a sharp back-to-school pattern while a hardware store sees relatively stable demand. When seasonal behavior depends on local events, generic national holiday features may add little value. Evaluate forecasts by segment and period rather than assuming one calendar model fits everything.
New products create a cold-start problem. A similar established item can sometimes provide a starting analogy, but substitution, branding, and availability matter. Begin with conservative assumptions, watch early sales and stockout signals, and update the forecast as evidence accumulates. Avoid interpreting slow initial sales as low demand if the new item was poorly displayed or unavailable online.
Explain Forecast Uncertainty to Buyers
Instead of telling a purchasing manager “buy 120 units,” a useful dashboard might show the expected demand, plausible range, lead-time assumptions, and consequences of several stocking choices. The recommendation should account for pending orders and expiry constraints. A supplier with unreliable delivery times may justify more buffer than a nearby supplier offering dependable next-day replenishment, even when average demand is identical.
Set clear override rules. Staff may know about a one-time local festival or a supplier closure that the model has not observed. Record the override reason, then assess whether the intervention improved outcomes. Human knowledge and forecasts can complement each other when neither is treated as automatically infallible.
Stockouts Distort the Demand You Observe
Sales history is not automatically demand history. If a product was unavailable for five days, the sales system may report zero units sold even though customers would have bought it. A forecast trained naively on those zeros can recommend even less stock and reproduce the shortage. Annotate periods of known unavailability, promotions, returns, and unusual closures before fitting a model. Where possible, use page-view demand, waiting lists, or backorders as supporting evidence, while acknowledging that these are imperfect proxies.
Keep decisions separate for stable products and short seasonal items. A long-running staple can use repeated cycles to estimate uncertainty; a new style of leggings may have almost no history and need a conservative launch quantity plus rapid replenishment. Reporting these limitations is more honest than presenting a single precise forecast for every SKU.
Frequently Asked Questions
Do small businesses need machine learning for forecasts?
Not necessarily. Simple seasonal averages can be a strong baseline; sophisticated forecasting should be adopted only if it improves decisions on held-out periods.
How much sales history is enough?
Enough history depends on seasonality, product turnover, and promotions. A short history can support cautious estimates but not reliable annual patterns.
Can AI predict new products accurately?
New products lack direct sales history. Use similar-item benchmarks, small test orders, and explicit uncertainty rather than confidently precise predictions.
Why are prediction intervals useful?
They show a plausible range rather than one number, helping managers weigh service level, stockout exposure, and carrying costs.
Further Reading on ByteScope
AI Data Analysis Tools
Measuring Digital Innovation Value
Sources and Further Reading
Forecasting: Principles and Practice — Cross-Validation — Forecasting textbook and methodology.
Forecasting: Principles and Practice — Accuracy — Forecasting textbook and methodology.