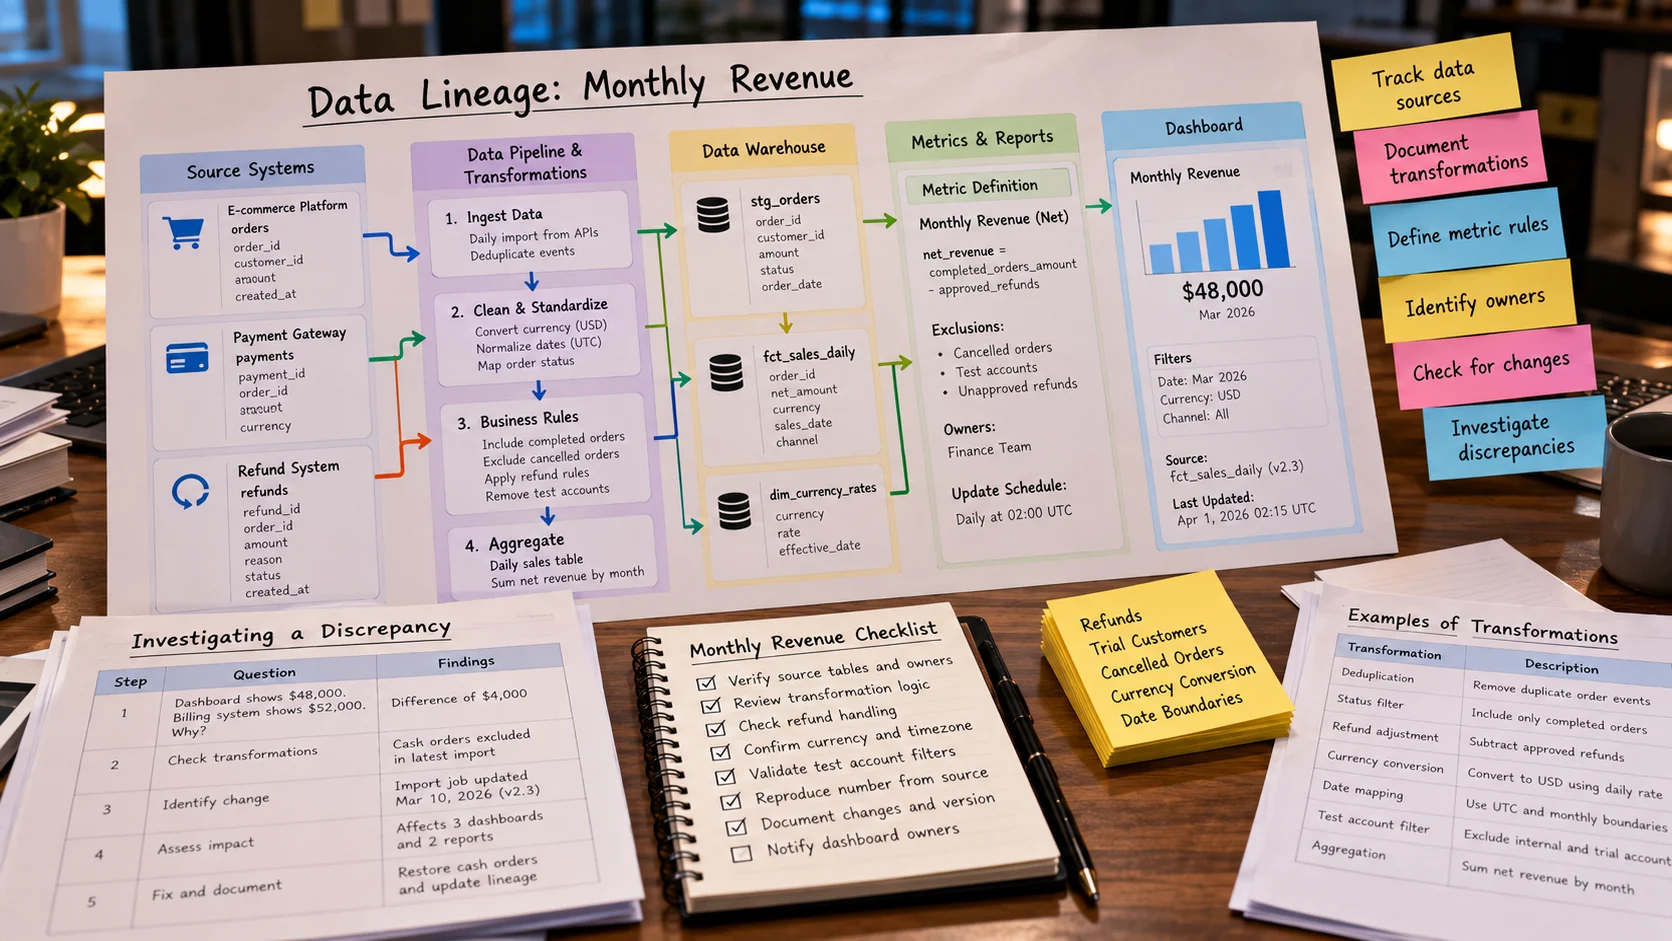
A finance dashboard reports monthly recurring revenue that differs from the billing system because refunds and trial customers are handled inconsistently. Data lineage documents the movement and transformation of data from its origins to reports, dashboards, models, and decisions. It helps teams explain which inputs produced a published number. Unlike a broad architecture diagram, this guide follows one metric backwards through fields, transformations, ownership, and tests. Quantitative examples below are hypothetical and should be adapted to the reader’s actual data.
Key Takeaways
Data lineage traces where a business metric originated and which transformations changed its meaning.
Technical lineage maps tables, columns, and jobs; business lineage explains definitions, owners, and exclusions.
A data dependency graph is not enough unless important transformations and their versions can be inspected.
Begin with a disputed number and reproduce it from source events, including the relevant reporting definitions, before attempting enterprise-wide mapping.
Use lineage to investigate reporting discrepancies, establish clear change ownership, preserve the reasons behind documented transformations, and assess the impact of upstream changes across connected systems.
Understanding Data Lineage With One Business Metric
A dashboard may report that monthly revenue increased by 12%. Before anyone makes a decision, a manager may ask where the figure came from, whether refunds were excluded, which currency conversion was used, and when the data was updated. Data lineage records the movement and transformation of data from its sources through intermediate systems to the final output. It makes such questions answerable with evidence rather than institutional memory.
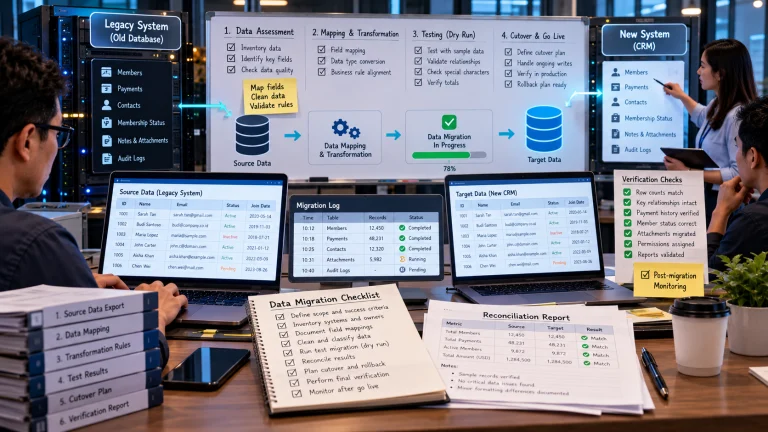
A company might collect order events in an e-commerce platform, copy them into a data warehouse, transform them into a daily sales table, and display a monthly chart. Each stage can change the meaning of the metric. An import may drop duplicate events; a transformation may filter cancelled orders; an aggregation may convert currencies or select a reporting timezone. A credible lineage record captures those dependencies and rules.
Technical Lineage Versus Business Lineage
Technical lineage describes tables, columns, jobs, queries, files, and pipeline dependencies. It can show that monthly_sales.net_revenue derives from orders.total, refunds.amount, and a currency-rates table. Business lineage explains the meaning: how the company defines “net revenue,” which transactions count, which owner approves the definition, and why a particular exclusion is applied.
Both views are useful. A developer tracing a broken transformation needs precise table names and job versions. A finance manager needs to know whether taxes, shipping charges, refunds, and disputed payments are included. A graph of column dependencies without metric definitions can still mislead business readers.
Lineage should also include provenance: where records originated, when they were collected, and any transformations that materially affect interpretation. For systems processing personal information, the record can help identify copies that must be updated or deleted after a legitimate request.
A Practical Revenue Lineage Example
Suppose a dashboard shows $48,000 of monthly sales. A simplified transformation might be:
net_sales = completed_order_amounts – approved_refunds
That formula is not universal accounting advice; it is a hypothetical definition for a teaching example. The lineage should identify the source status meaning, treatment of partial refunds, currency and tax rules, date boundaries, and the exact transformation version. Without those details, two teams may both claim to report “sales” while using incompatible definitions.
Imagine that an import begins excluding cash orders accidentally. The final chart still renders normally and the query executes without error. Lineage helps investigators trace the affected metric back through the daily table and import job to the source feed. They can identify the change date, find downstream dashboards using the same table, and repair the pipeline without guessing which reports were affected.
Levels of Data Lineage
Dataset-level lineage shows which tables, files, or systems feed another dataset. It is comparatively easy to capture and valuable for impact analysis. Column-level lineage traces individual output fields to source fields and transformations. It can explain why a revenue column changes while a count column remains stable. Record-level provenance may identify specific source records contributing to an output, though detailed tracking can be expensive or inappropriate depending on privacy and scale.
Choose the level that meets the decision. A small business may start with dataset-level diagrams and documented transformations for its most important metrics. Advanced organizations may automate column-level capture from SQL or orchestration metadata. More detail is not inherently better if nobody maintains or uses it.
Building Lineage Without a Major Platform Purchase
Choose a critical output. Start with one dashboard, report, or automated decision that causes confusion or rework.
Document the metric definition. Write the inclusion and exclusion rules, units, reporting period, timezone, and accountable owner.
Identify immediate upstream inputs. Record tables, APIs, spreadsheets, and manual adjustments feeding the output.
Trace each transformation. Capture joins, filters, calculations, deduplication, mappings, and aggregation rules. A saved query or version-controlled script is stronger evidence than a vague description.
Identify ownership and refresh timing. Note who operates each pipeline and how late or missing updates appear to downstream users.
Create a dependency view. A simple diagram with source, transformation, dataset, and report can be sufficient for a pilot.
Test change impact. Ask what would break if one field changed type or one source stopped arriving. Use the map to find affected reports.
Keep the record current. Connect updates to the existing change-management process so lineage does not become a stale one-time document.
A spreadsheet can track source systems, outputs, owners, update frequency, and known risks. For more complex stacks, catalogs and orchestration tools can capture parts of lineage automatically. However, automated technical extraction rarely understands every business definition or informal spreadsheet adjustment; human documentation remains necessary.
How Lineage Supports Debugging and Governance
Lineage shortens incident investigation by identifying possible upstream causes and affected downstream consumers. When a source field changes or a scheduled job fails, a dependency map helps prioritize repairs. It also supports change review: renaming a column is less risky when engineers know which reports and models depend on it.
In analytics governance, lineage helps resolve disputes about metrics. Two dashboards reporting different revenue figures may be using different sources or filtering logic. Rather than deciding which one “looks right,” compare definitions and transformations. Publish an approved metric definition and make deviations explicit.
For privacy operations, lineage may help locate copies of personal records across ingestion, warehouse, reports, and exports. Yet a lineage diagram alone does not guarantee complete deletion; cached results, backups, logs, and downstream recipients may require separate treatment.
What Good Lineage Documentation Includes
Useful entries specify source identifier, source owner, transformation logic or script reference, output field, data type and unit, refresh schedule, validation tests, and last verified date. Also document manual steps, because a person editing a spreadsheet can introduce changes invisible to automated job metadata.
Build tests around the map. Counts may be reconciled between source and destination; monetary totals may be checked within defined tolerances; schema changes may trigger alerts. An alert should name the affected data product and owner, not merely report that a generic pipeline failed.
Limits and Costs
Capturing every transformation at extreme detail may introduce overhead, storage, and complexity. Sensitive lineage logs can reveal table names, operational processes, and private-data locations, so access should be controlled. Some AI-generated SQL and dynamic transformations are difficult to parse automatically. Tool vendors may overstate completeness if manual work or unusual data flows are excluded.
Keep the first scope small and test its usefulness during a real change or incident. A diagram that helps staff answer “where did this number come from?” and “what will this change affect?” is more valuable than a huge catalog with missing ownership information.
Data lineage makes information accountable. It connects the numbers seen by decision-makers to the records, definitions, and transformations that produced them, enabling corrections based on evidence rather than memory.
Following a revenue number back to raw events
A dashboard shows “monthly revenue = $82,400,” but the finance team expects $79,600. A lineage diagram should trace the number through dashboard measure → reporting mart → transformation job → payments table → source transaction feed. At each edge, check the code version, filter, currency conversion, refresh time, and ownership. The difference may be explained by refunds arriving after a snapshot was built, not by an arithmetic error in the chart.
payments_api -> raw_payments -> net_revenue_transform
-> finance_mart -> revenue_dashboard
The diagram is illustrative. Column-level lineage is more useful than a generic list of systems when only net_revenue has changed. Event-based standards such as OpenLineage can record which job read or wrote which dataset, but annotations and instrumentation must be maintained to stay useful.
What the example teaches. Revenue appears different in finance and sales dashboards. Finance excludes refunded orders; sales counts transactions at purchase time. A lineage walk reveals that the dashboards transform the same billing events differently. Aligning the metric definition resolves the disagreement more effectively than changing chart colors.
A Lineage Map Can Reveal Two Different Sales Definitions
Suppose a sales dashboard draws from fulfilled orders, while an accounting report draws from settled payments. Both numbers may be legitimate within their stated purposes but should not use the same unexplained label. Lineage documentation traces each to its source and transformation rules, allowing managers to see where the definitions diverge. A reconciliation note might explain that one report uses fulfillment date and the other settlement date, or that one excludes specific refunds.
Instead of forcing one team to adopt the other’s number without context, name each metric precisely and document which decisions it supports. This is especially valuable when an organization expands from spreadsheets into shared analytics tools; different assumptions otherwise become hidden inside dashboards.
Responding to an Upstream Schema Change
Imagine a partner changes a field from order_total to gross_amount and introduces net_amount. A job that simply renames the old field may continue producing a chart while silently changing meaning. A lineage-aware change process identifies affected transformations, reports, and owners before deployment. Engineers can update mappings, rerun validations, and compare historical outputs under the new definition.
Lineage only helps when current. Connect technical changes to documentation updates and periodically review high-impact metrics with business owners. If a report still references a retired transformation, flag it rather than implying that the lineage map remains complete.
Assessing Whether a Catalog Tool Is Worth It
Choose between manual documentation and dedicated tooling based on scale and workflow. A small business with a handful of nightly imports may benefit from clear diagrams, saved queries, and ownership tables. A larger environment with hundreds of transformations may need automatic discovery and impact analysis. Test whether the platform captures the specific SQL, APIs, and spreadsheets actually used; an attractive graph that omits manual steps can be dangerously incomplete.
Record Transformations, Not Merely File Locations
Knowing that a dashboard reads from a warehouse table is useful but incomplete. The important question may be how that table was calculated. For a revenue metric, record source event types, currency conversion rules, refund handling, deduplication, exclusion logic, transformation versions, and the date range used. A field labeled revenue can represent bookings in one report and collected payments in another. Without business semantics, a visually impressive lineage graph still leaves the central question unanswered.
Start with one disputed metric rather than attempting to map an entire organization at once. Trace a number backwards until the team can reproduce it from agreed source records. Note every transformation and owner encountered. Then add automated metadata collection where useful. This bottom-up exercise usually exposes missing definitions that a diagram alone would never reveal.
Use Lineage to Investigate an Unexpected Metric Change
Imagine a revenue report falls sharply overnight but sales teams report normal activity. Start at the published chart and inspect its data refresh time. Then follow the transformation job, warehouse table, ingestion process, and underlying payment events. If the source events exist but a new transformation excludes a payment status, the discrepancy is a logic defect rather than a sales decline. Record the faulty version, affected reporting periods, and corrected result.
This example illustrates why lineage should be connected to monitoring and change management. A diagram alone tells engineers what depends on what; a monitored, versioned lineage record helps them determine when a number stopped meaning what the organization thought it meant. That evidence also helps finance explain the correction to stakeholders.
Frequently Asked Questions
How is lineage different from a data catalog?
A catalog tells people what datasets mean and where they reside; lineage shows how information moved and changed between them.
Can small businesses document lineage manually?
Yes. A spreadsheet listing source tables, transformations, owners, and dashboard fields is a useful first step for one critical metric.
Why do two dashboards show different numbers?
They may apply different filters, reporting dates, conversion rates, refund rules, or joins. Lineage helps locate the precise divergence.
Does lineage improve compliance?
It can provide evidence of processing and changes, but meeting legal obligations also requires access controls, retention practices, and appropriate governance.
Further Reading on ByteScope
Innovation Debt
Measuring Digital Innovation Value
Sources and Further Reading
OpenLineage: Introduction — OpenLineage project technical documentation.
UK Government: Data Quality Framework — Primary background reading; confirm applicability to your use case.