A rough meeting note says: “Customer sends a form, the coordinator checks it, finance approves the refund if the amount is above $200, and support sends a confirmation.” Turning that sentence into a readable process diagram takes longer than it should if every shape is drawn by hand. AI diagram generators can propose flowcharts, mind maps, and system diagrams from plain-language descriptions. Their promise is speed; their limitation is that they cannot know whether a company’s actual process matches the prompt.
For business use, a useful diagram must be accurate, editable, accessible, and clear about decisions and responsibilities. This guide explores how to move from text to a trustworthy visual, which tools fit different situations, and why review is essential before a diagram becomes documentation.
What counts as an AI diagram generator?
Some tools convert a prompt directly into editable shapes on a canvas. Others produce text-based diagram definitions—such as Mermaid syntax—that can be rendered by a compatible viewer. A third group helps arrange and label existing shapes, interpret whiteboard photographs, or suggest missing steps. Their capabilities vary by product and subscription, so always check the current vendor documentation.
Miro, for example, documents AI-assisted creation of diagrams and mind maps, while Mermaid offers a text syntax for constructing flowcharts and other diagram types. Those approaches solve related but different problems: an interactive whiteboard supports collaborative editing, whereas diagram-as-code can be versioned alongside software documentation.
An image generator that produces a pretty picture containing boxes and arrows is not necessarily a good process-diagram tool. If arrows cannot be adjusted, labels are misspelled, and shapes are not individually editable, maintenance can become harder than drawing the original. Choose an output format appropriate to how often the diagram will change.
Start with the purpose, not the drawing style
Different diagrams answer different questions. A flowchart shows decisions and paths; a swimlane diagram clarifies which team or role owns each step; a sequence diagram shows interactions between systems over time; an entity-relationship diagram describes data structures. A mind map explores relationships among ideas without necessarily describing executable steps.
Before writing a prompt, ask who will use the diagram. A new employee might need a simple overview of the refund process. An engineer may need error branches, webhook retries, and source-system boundaries. A manager may need responsibilities and escalation points. One diagram should not try to serve all audiences at equal detail. Its visual density should match the decision the reader needs to make.
Be precise about the starting condition and desired endpoint. “Show our onboarding process” is less useful than “Map the journey from signed contract to first login, distinguishing customer actions, operations team checks, and IT provisioning.” Give the generator enough constraints to express the real workflow rather than invent one that looks familiar.
A practical prompt for a refund flowchart
Consider this input:
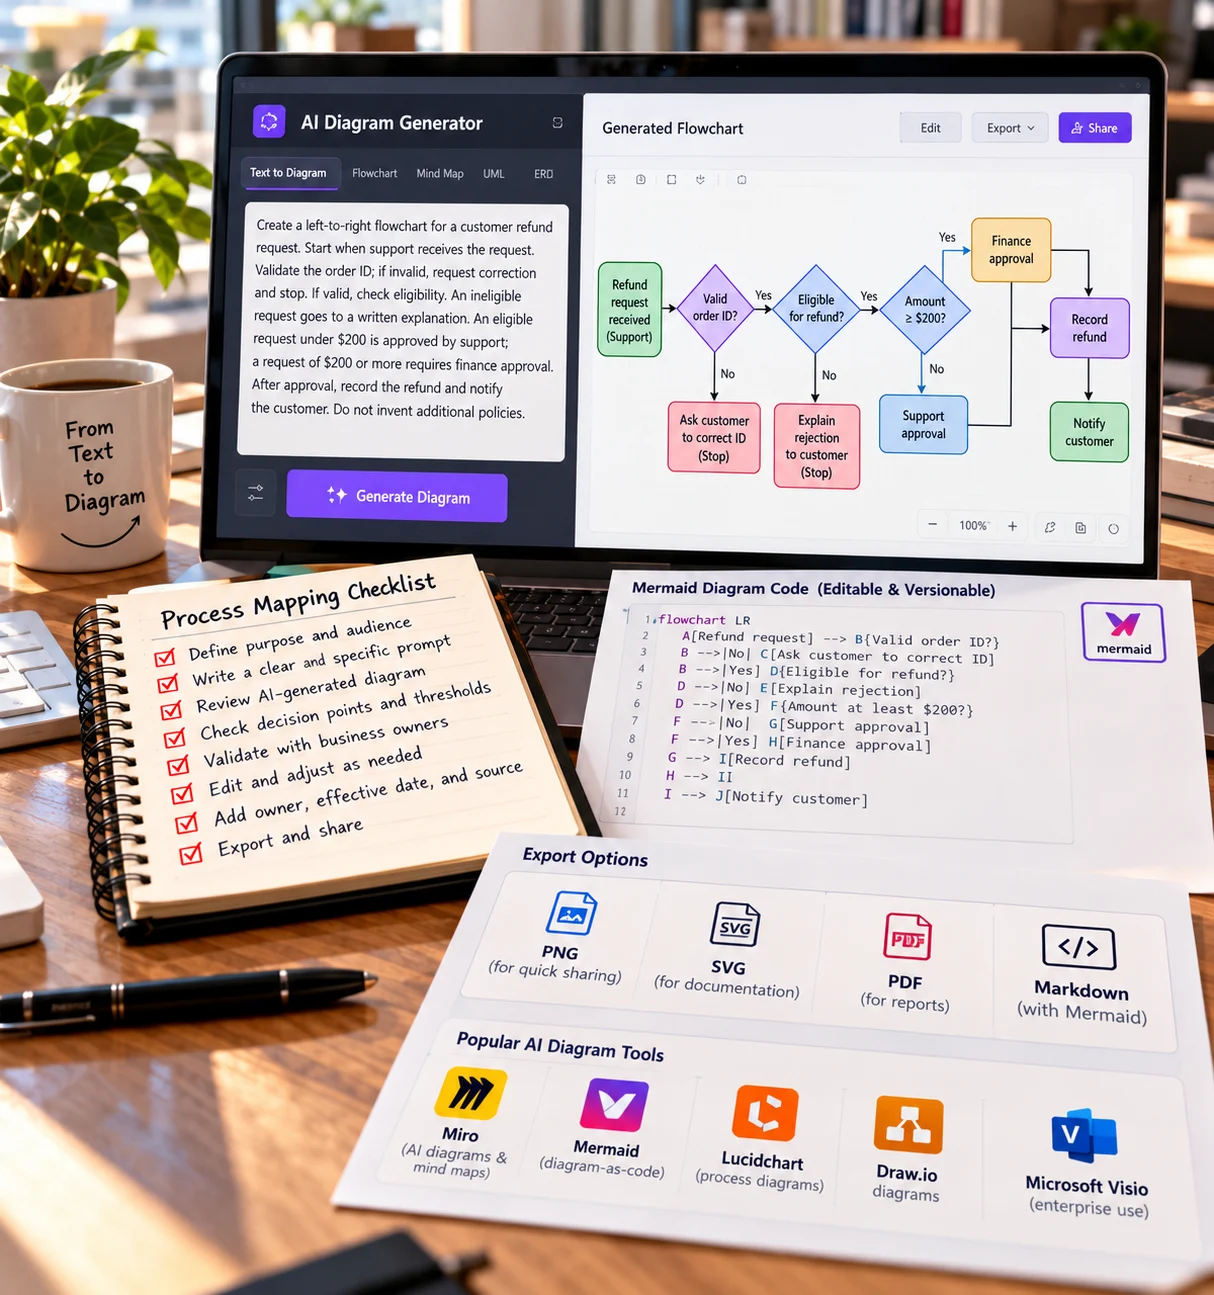
Create a left-to-right flowchart for a customer refund request. Start when support receives the request. Validate the order ID; if invalid, request correction and stop. If valid, check eligibility. An ineligible request goes to a written explanation. An eligible request under $200 is approved by support; a request of $200 or more requires finance approval. After approval, record the refund and notify the customer. Do not invent additional policies.
This prompt names decisions, thresholds, outcomes, and a prohibition on invented conditions. It does not ask the AI to decide what a reasonable refund policy ought to be. That policy must come from the organization, because adding an imaginary approval path could have financial consequences.
The first output should be treated as a structured draft. Inspect the branches: does “$200 or more” go to finance, and “under $200” remain with support? Is the invalid-order path shown? Does the final notification occur only after the refund is recorded? If any branch is ambiguous, edit the diagram or prompt rather than assuming viewers will infer the correct intention.
From prose to Mermaid diagram code
Diagram-as-code is useful when a team wants reviewable changes. Here is a simplified Mermaid example:
flowchart LR
A[Refund request] –> B{Valid order ID?}
B –>|No| C[Ask customer to correct ID]
B –>|Yes| D{Eligible for refund?}
D –>|No| E[Explain rejection]
D –>|Yes| F{Amount at least $200?}
F –>|No| G[Support approval]
F –>|Yes| H[Finance approval]
G –> I[Record refund]
H –> I
I –> J[Notify customer]
The code makes the flow inspectable by someone who may not use the diagram tool. Version control can show that an approval threshold changed from one value to another. If a WordPress page cannot render Mermaid automatically, export an accessible SVG or PNG and retain the source file separately. Syntax and diagram-type support should be checked against the current rendering tool.
Even correct syntax does not mean correct policy. A diagram can faithfully express an outdated business rule. Attach an owner, effective date, source document, and review schedule to important process diagrams. Treat them as controlled operational documents, not decorative graphics.
How to compare AI diagram tools
Evaluate tools according to the work your team actually does. Editability: can people change individual nodes, labels, and connections? Portability: can the diagram be exported in a usable format without losing critical structure? Collaboration: can reviewers comment and track revisions? Data handling: is confidential workflow information protected? Accessibility: are labels and color choices readable to all users?
For technical documentation, support for Mermaid, PlantUML, or another text format may matter more than a polished theme. For workshops, collaborative canvases and sticky notes may be more valuable. For architecture diagrams, accurate library symbols and connectors may matter. No single category of tool wins every use case.
Test using one awkward real example, not a vendor’s ideal prompt. Include a loop, a rejected branch, a handoff between teams, and a conditional exception. If the tool consistently removes these details, it is unsuitable for that workflow even if the initial graphics look impressive.
Checking logical correctness
Process diagrams are particularly vulnerable to silent omissions. Inspect every decision diamond for complete outcomes. If a condition is true, what happens? If false, what happens? If a step fails, does work stop, retry, or escalate? Can two branches accidentally trigger the same irreversible operation? Are parallel tasks explicitly distinct from alternatives?
Use a written checklist alongside visual inspection. A refund flowchart should not bypass a required finance approval. An onboarding diagram should not grant credentials before identity verification. A maintenance diagram should identify the stop condition for unsafe equipment. These questions depend on domain expertise, not visual fluency.
For complex flows, walk through sample cases. A $150 eligible refund should follow one path; a $450 eligible refund should follow another; an invalid order ID should not reach payment processing. Trace each scenario with a finger or cursor. The method is simple but often exposes missing connectors that a generator overlooked.
Avoiding diagrams that look better than they explain
Visual clarity depends on labeling, alignment, and restraint. Use short verb-led labels such as “Check eligibility” and “Record refund.” Put detailed policy language in notes or linked documentation. Differentiate a decision from an action using shape conventions and ensure arrow direction is consistent. Avoid using color as the only signal of status, because some readers cannot reliably distinguish certain colors.
A crowded diagram often needs to be split. One overview can show “Validate request → Approve → Process → Notify,” while a second diagram describes exceptions and approvals. Keep both linked to the same approved source. This improves readability and reduces the chance that viewers confuse one possible edge case with the default process.
Remember that diagram accessibility also includes text alternatives. Provide a concise description of the overall process and a linear list of decision paths when publishing to a website. An unlabeled image alone can exclude readers using assistive technology.
Where AI assistance adds the most value
AI is helpful when moving from unstructured meeting notes to a first representation, suggesting candidate labels, converting among supported diagram formats, or reorganizing a long list of steps. It can also help document legacy workflows by extracting proposed process stages from written manuals for human verification.
In software projects, diagram-as-code can live next to source code, making it easier to review workflow changes together with implementation changes. But generated diagrams must not become a substitute for reading the code or observing the actual system. If a service behaves differently from the diagram, the team needs to discover the discrepancy rather than trusting the prettier artifact.
The ByteScope guide to AI design tools covers broader graphic creation; process diagrams demand a stronger emphasis on accurate branch logic than marketing visuals. The article about workflow automation provides a complementary view of how documented steps can be connected to real systems.
Working with confidential business processes
A company’s process map may reveal internal controls, security reviews, suppliers, pricing thresholds, or customer data flows. Review whether uploading the description to a third-party AI service is permitted. Remove unnecessary names and credentials, use organization-approved accounts, and assess retention and sharing settings before importing internal diagrams.
Publishing a diagram can itself be sensitive. A public troubleshooting flowchart may be harmless, while an internal diagram that exposes fraud thresholds or credential recovery details could create operational risk. Assign visibility according to the document’s purpose. Exported images and collaboration links deserve the same review as the source canvas.
Common failure modes
One failure is confusing sequence with responsibility. A flow may be ordered correctly but fail to identify who performs the action. Another is invented policy: the generator adds an approval because it seems sensible, not because it is real. A third is visually hidden complexity: a tangled diagram makes a critical exception almost impossible to follow.
Version drift is a fourth problem. Teams revise the WordPress screenshot but forget to update the editable source—or vice versa. Keep one authoritative diagram file and record the revision date. Finally, avoid using the diagram to certify that the workflow has been tested; operational acceptance requires observing actual cases.
A diagram review exercise for onboarding
Suppose the draft employee-onboarding diagram contains these steps: HR receives a signed offer, IT creates an account, the employee completes verification, and the manager approves equipment access. Look closely at the order. If account creation happens before identity verification, what prevents a record for the wrong person? If equipment approval can be denied, where does that branch lead? Does the manager’s approval trigger a notification, or does somebody need to check the dashboard manually?
Rewrite the procedure in numbered sentences independent of the picture. Then walk through three cases: a straightforward new hire, a hire who withdraws before the start date, and a contractor who needs limited access. The diagram should let readers locate the correct outcome for each case. If it cannot, it needs more than improved styling—it needs a better process definition.
For a technical sequence diagram, test ordering of messages. An API request followed by a database write should show what happens if the write fails and whether the client is told that processing succeeded. A generated image may draw a clean arrow from “request” to “success” while omitting the failure response, which is often the most valuable thing to document.
Maintain source and publication copies together
When publishing a diagram on WordPress, save the accessible export and the editable source under one version identifier. Update both when policies change. If the source is Mermaid code, store that code alongside the documentation; if it is an interactive whiteboard, identify the authoritative board and the owner who can edit it. Record the date when the workflow was last verified by someone responsible for its operation.
A diagram also needs a text description. Describe the main flow and important decision branches in prose so the content remains useful to visitors using screen readers or text-only browsing. Search engines may discover the surrounding explanation more effectively than an image alone, but accessibility is primarily about helping readers understand the information.
Frequently asked questions
Can AI create an accurate diagram from one sentence?
It can propose a starting point, but one sentence rarely contains all required conditions, owners, exceptions, and constraints. Accuracy rises when the input provides clear rules and the output is verified by someone who knows the process.
Should I choose image-based or code-based diagrams?
Choose editable, structured output when a diagram will change often. Image-based exports work well for publication, but retaining a source file makes updates safer and less costly.
Are generated flowcharts suitable for policy documents?
They can be after review and approval. A generated diagram does not have authority until the responsible owner confirms its rules and versions it appropriately.
A useful final validation is to ask a new employee to follow the diagram without verbal help. If they cannot tell who owns an exception, where a rejected request goes, or which system records completion, the visual is still incomplete. This real-reader test reveals usability gaps that a syntactically correct flowchart cannot detect.
Conclusion
AI diagram generators can shorten the path from a messy explanation to a useful visual. The best results come from choosing the right diagram type, specifying rules precisely, testing branches with realistic examples, and retaining an editable source. A good diagram is not the most elaborate image; it is one that helps readers understand what actually happens—and what should happen when something goes wrong.
References
Mermaid: Flowchart syntax
Miro Help Center: AI diagrams and mind maps