A machine-learning model that memorizes yesterday’s observations can perform brilliantly in training and poorly tomorrow. Another model can be so simple that it misses the useful pattern even in the examples it has already seen. These are the two familiar but often misunderstood failure modes behind overfitting versus underfitting.
The distinction matters to anyone evaluating predictive AI. More data, a larger model, or longer training is not a universal fix. Each intervention changes how a system learns, and the right choice depends on whether the model has captured too much incidental detail, too little meaningful structure, or simply faces a different production population.
Key takeaways
Overfitting typically produces a large train–validation performance gap; underfitting often performs poorly on both.
Validation design must reflect how the model will be used, or neither diagnosis is reliable.
Regularization, simpler models, early stopping, and additional representative data can help overfitting; better features or sufficient model capacity can help underfitting.
Learning curves and error analysis are more informative than a single training accuracy score.
What overfitting looks like in practice
Suppose a retailer trains a model to forecast daily demand. The model learns that a particular item sold unusually well on three rainy Saturdays. A very flexible model might create intricate rules around those three observations, treating accidental details as stable relationships. On the training days the forecasts look nearly perfect. On later Saturdays, errors grow because the rules describe historical noise rather than repeatable demand.
Overfitting is not always outright memorization. A neural network may learn subtle correlations that exist in its particular dataset but are weak or absent outside that sample. A decision tree may partition its training records until each leaf has only a few examples. A text classifier may learn document boilerplate associated with the labels in its training corpus rather than the underlying subject. The common issue is weak generalization.
If the training error is very low but error on a well-designed validation set is substantially higher, overfitting becomes a plausible diagnosis. Yet the gap alone is not proof. Distribution shifts, incorrect preprocessing, data leakage, and labeling differences can create similar patterns. Diagnose the evaluation process before adjusting the algorithm.
What underfitting looks like
Now consider a linear model predicting restaurant traffic using only the day of the week. Real demand also depends on weather, local events, school breaks, promotions, opening hours, and seasonal travel. Even with perfectly optimized coefficients, the simple model cannot represent those omitted influences. Training error remains high and validation error is similarly high.
Underfitting occurs when a model fails to capture useful structure in its training data. The limitations may come from insufficient features, inappropriate assumptions, excessively strong regularization, weak training, or a model that lacks the capacity to represent the relationship. A highly capable model can still underfit if optimization stops too early or if the labels and inputs are too noisy to learn from.
There is an important distinction between a model that is too simple and a prediction task that is genuinely unpredictable from its available inputs. If the same data cannot support a better estimate, increasing network size will mostly increase cost and the chance of fitting noise. Investigate whether the problem contains usable signal before assuming complexity is the solution.
Reading train and validation results correctly
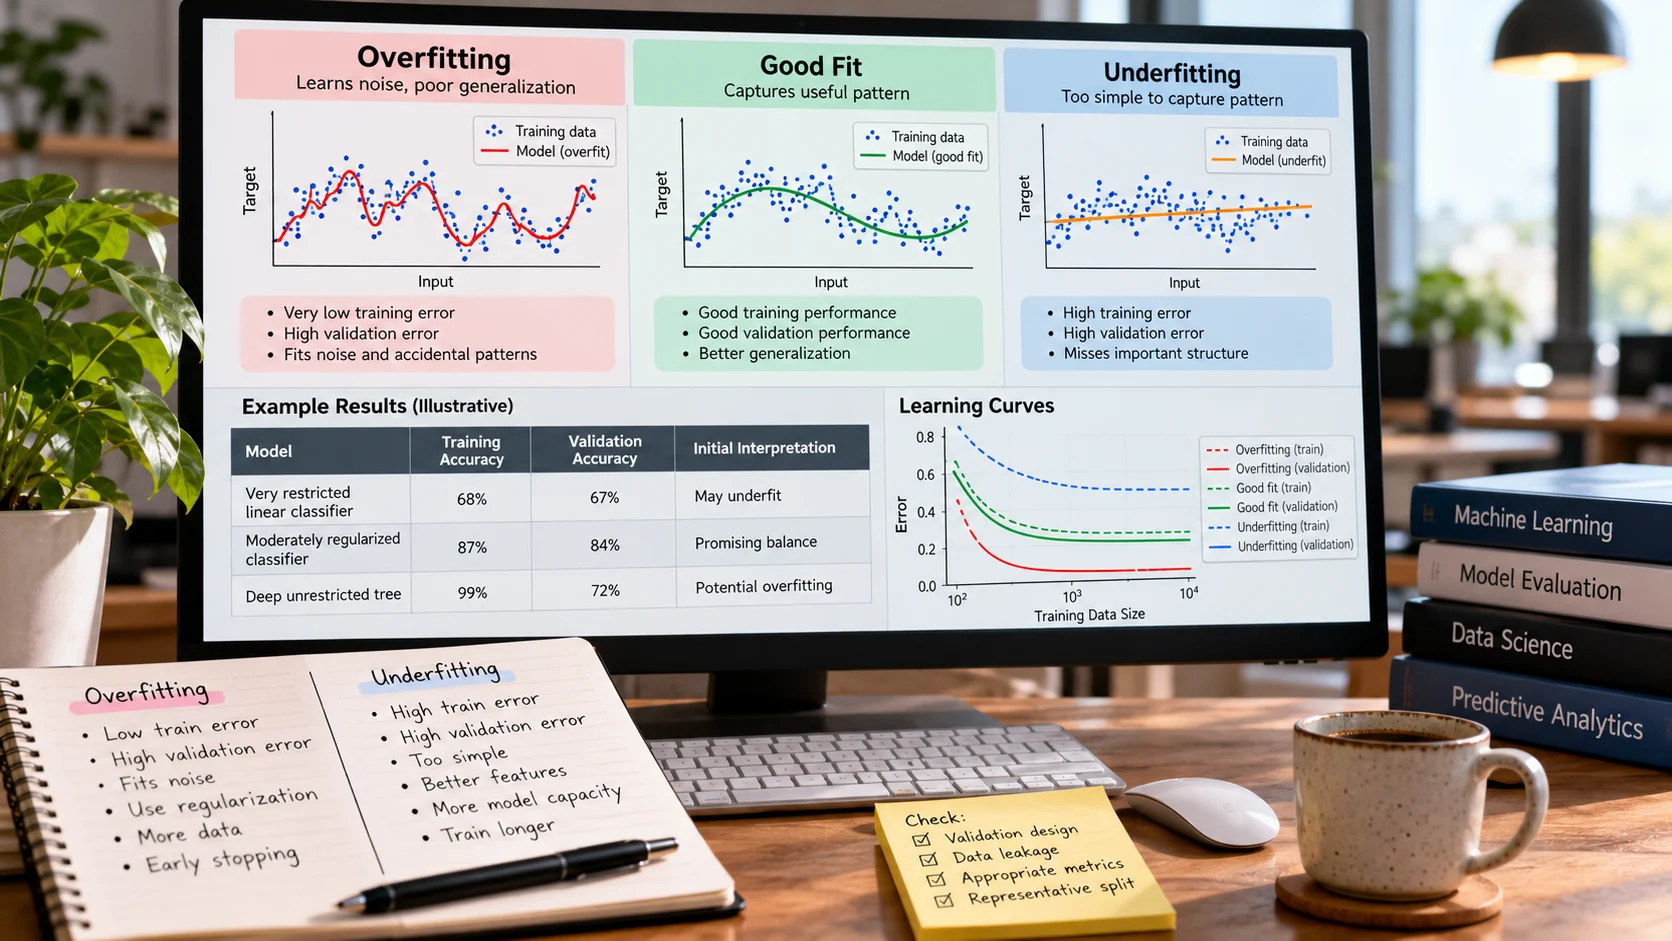
Imagine an illustrative classification experiment on identical held-out data. The table is fictional and intended to explain diagnostic patterns, not to benchmark real models.
Model Training accuracy Validation accuracy Initial interpretation
Very restricted linear classifier 68% 67% May underfit
Moderately regularized classifier 87% 84% Promising balance
Deep unrestricted tree 99% 72% Potential overfitting
The third model has the best training accuracy and the worst evidence of generalization. The first could be limited by its features or could face a difficult task; the table alone cannot settle which. In a dataset where positive cases are rare, accuracy may be a particularly poor metric. Report class-sensitive metrics, business costs, and performance across meaningful groups alongside this comparison.
Repeat the experiment using multiple appropriate splits where feasible. An advantage of only two percentage points may reflect sampling noise rather than a reliable improvement. For small datasets, quantify uncertainty rather than presenting single decimals as though they represent permanent truth.
Learning curves: a useful diagnostic tool
A learning curve plots model error or score against the amount of training data. With severe overfitting, a flexible model often starts with excellent training performance and noticeably weaker validation performance. As the training set grows, the gap can narrow because incidental patterns become harder to memorize. With underfitting, both curves may converge at a disappointing level: adding examples alone does not overcome a missing predictor or overly restrictive model.
Learning curves are guides, not rigid signatures. The training procedure must be consistent as sample size changes, and each subset must be representative. If time matters, use chronological subsets rather than randomly mixing future information into earlier training. If several rows belong to one customer or device, preserve group boundaries. Otherwise an apparent learning curve may mostly be measuring repeated exposure to familiar entities.
Track not just mean performance but its spread across folds or periods. A model with good average accuracy but catastrophic errors during peak demand may be unsuitable for stock ordering. The curves should help direct the next experiment, not replace a decision about the business risk.
The bias–variance explanation, with caveats
Underfitting is often associated with high bias: the model is systematically unable to express a useful relationship. Overfitting is often associated with high variance: model predictions change too much depending on which examples appear in training. This is a helpful teaching lens, particularly for classical statistical learning, but not a full theory of every modern neural network. Deep models can show more complex behavior, including settings where larger capacity improves both training and test performance.
Regularization changes the trade-off by discouraging unnecessarily complicated solutions. Adding an L2 penalty to a regression or classification model discourages large coefficients; early stopping prevents continued optimization after validation performance stops improving; a smaller tree depth limits partitions. But regularization that is too strong can push a useful model toward underfitting.
The correct objective is not the smallest gap between training and validation. A model that performs badly on both may have an admirably small gap and still be useless. Aim for the best generalization and decision performance under realistic constraints.
Fixing overfitting without guessing
Start by establishing the scale of the problem: compare training with validation performance, examine where the errors occur, and rule out accidental leakage. Then test one coherent intervention at a time. Reduce tree depth or minimum leaf size for tree methods; adjust regularization strength in linear models; use early stopping and appropriate weight decay for neural networks; limit an unnecessarily complex feature set; or gather more representative training examples.
Data augmentation can help in images, audio, and some text tasks if transformations preserve the true labels. Horizontal flipping may be reasonable for certain object photographs but disastrous for recognizing left-versus-right road signs. Similarly, fabricated examples should not teach impossible patterns. Augmentation quality matters more than the number of additional samples.
Ensembles can sometimes improve generalization. Bagging reduces the sensitivity of some learners to individual training samples, while boosting can fit complex patterns if regularized carefully. The claim is not that a particular method is always safer. Evaluate it on the same appropriate holdout and consider inference cost and interpretability.
Fixing underfitting and identifying missing signal
If both training and validation performance remain weak, ask whether the features describe the phenomenon. For demand forecasting, adding weather and planned promotions may be more valuable than switching from a simple baseline to a much larger neural network. For text classification, task-specific representations may matter more than elaborate classifier tuning. For sensor predictions, the sampling frequency and measurement quality may set the upper bound on what any model can learn.
Next check the training configuration. A neural network may need more optimization steps, a suitable learning rate, or a less restrictive regularizer. A linear model might be improved with meaningful interactions or nonlinear basis functions. A tree may require greater depth. Increase complexity gradually, comparing not only accuracy but calibration, serving latency, operational stability, and whether features will actually be available online.
Sometimes the right answer is to narrow the problem. Predicting an exact delivery minute may be much harder than predicting whether a package is likely to miss a two-hour window. Choosing an output that corresponds to the real decision can make a model both more learnable and more useful.
Step-by-step experiment: customer churn
Assume a subscription business wants to identify likely churn within the next 30 days. Begin with a baseline based on recent product usage and subscription tenure. Create a chronological split: earlier accounts or months for training, later periods for validation, with precautions against outcome leakage. Record a metric such as precision at the outreach team’s fixed capacity rather than relying only on accuracy.
Train a simple regularized classifier and chart learning curves. Then add domain-relevant signals, perhaps support wait time or recent feature adoption, provided those signals existed before the prediction point. If training and validation performance both rise, the earlier model was missing useful information. If training performance rises while validation stalls, investigate overfitting, data problems, or features that do not generalize.
Finally, make the intervention actionable. A churn score cannot prove why a customer may leave. Test outreach policies responsibly rather than assuming that the strongest predictive feature identifies the best treatment. Document how your threshold affects false alarms and missed customers, then monitor changes after launch. That distinction between prediction quality and operational value is central to interpreting AI benchmarks correctly.
Validation mistakes that mimic model failures
An incorrect split can make a good model look better than it is. For example, near-identical records can appear in both training and validation partitions, or a forecast can be evaluated using later observations. Our related guide to training data fundamentals explains why collection and labeling practices shape what a model can learn. Overfitting diagnosis becomes unreliable when the evaluation boundary is already compromised.
A second mistake is tuning hyperparameters repeatedly on the final holdout set. After many experiments, the holdout effectively becomes another training signal for model selection. Keep a separate final evaluation or use an appropriate nested procedure when tuning is extensive. A third mistake is overlooking data quality: inconsistent labels create an apparent ceiling even when the architecture is appropriate.
When a simple model is the better choice
In many business settings, the operationally best model is not the one with the highest lab score. A simpler model may be easier to inspect, calibrate, retrain, and explain. It may run at lower cost, fail in more predictable ways, and require fewer unavailable features. Where decisions must be audited, those benefits can outweigh a small statistical performance improvement.
Keep a strong baseline and articulate what a more complex model buys. If the improvement is uncertain, concentrate effort on better labels, more representative cases, and evaluation that matches the real workflow. Model complexity should be earned by reliable evidence.
Choosing the next experiment when the curves disagree
A practical diagnosis table can translate observations into actions. If training score is poor and validation is similarly poor, inspect missing predictors, label quality, optimization, and capacity. If training is excellent while validation is weak, first examine leakage or distribution mismatch; only then test regularization or more representative data. If both scores are strong but the business outcome is disappointing, the issue may be threshold choice, metric selection, or workflow design rather than fitting behavior.
A useful experiment changes one material factor at a time and records the hypothesis beforehand. For example, “Limiting decision-tree depth will reduce sensitivity to rare training observations without materially hurting validation recall.” Run several appropriate splits and report the variation. If the intervention improves one metric while harming a high-cost customer segment, that trade-off deserves discussion rather than being hidden by one overall number.
This discipline prevents circular tuning. It also preserves the value of simpler baselines, which frequently reveal whether a complex model’s apparent improvement is robust or an artifact of one favorable validation sample.
Frequently asked questions
Does more training data always reduce overfitting?
No. More representative and correctly labeled data often helps, but duplicates, inappropriate sampling, or future-contaminated records can make matters worse. Some tasks also have irreducible uncertainty that quantity alone cannot fix.
Can an underfitting model have excellent test accuracy?
If the task is imbalanced or the metric misleading, yes. A classifier that predicts the majority class may show high raw accuracy while failing to identify the minority events the business cares about. Evaluate against a meaningful baseline and task-specific metrics.
Is a large neural network automatically overfit?
No. Capacity creates possibilities, not destiny. Optimization, architecture, data quantity, regularization, and validation all influence generalization. Diagnose observed error patterns rather than inferring failure from parameter count alone.
Conclusion
Overfitting and underfitting describe different mismatches between what a model learns and what the problem requires. The useful workflow is to start with a trustworthy validation design, read training and evaluation errors together, inspect learning curves, and run controlled experiments that address the likely cause. Better models are not simply bigger or more tightly regularized; they are better aligned with the information and decisions they will face.
References
scikit-learn: Learning curves
scikit-learn: Common pitfalls