A machine learning model can pass its pre-launch tests and become less useful months later without any change to its code. The customers it serves may change, business policies may shift, or data pipelines may start recording familiar events differently. These changes create a difficult operational question: is the model drifting, or is something else wrong?
AI model drift is a useful umbrella term for changes that undermine the assumptions behind a deployed model. The phrase is sometimes used specifically for declining predictive performance, but teams also use it when discussing changes in input data and prediction distributions. A monitoring system must make those distinctions explicit. Otherwise, it can generate a stream of warnings without helping anyone make a better decision.
This guide explains the major types of drift, what can and cannot be monitored before labels arrive, and how to investigate a real decline in model quality. The examples are hypothetical, but the workflow is practical for small teams as well as larger machine learning operations.
Key Takeaways
Data drift describes a change in the distribution of inputs; it does not by itself demonstrate worse predictions.
Concept drift concerns a changing relationship between inputs and the target the model is expected to predict.
Changes in business policy, data definitions, and delayed labels can imitate model problems.
Monitoring should combine data checks, prediction trends, labeled outcome metrics, and subgroup analysis.
Retraining is one possible response, not the automatic answer to every unusual chart.
What AI Model Drift Actually Means
During training, a model learns patterns from a particular dataset. That dataset has a time period, a population, a definition of the target outcome, and assumptions about how features are collected. Deployment exposes the model to new transactions and decisions that may not match those assumptions.
A model trained to predict product returns, for example, might use purchase channel, item category, order history, delivery time, and price information. These features can remain technically valid while their significance changes. A sudden increase in international orders alters the customer mix. A new free-returns policy changes the meaning of purchase behavior. An update to the logistics system can redefine how delivery delays are recorded.
Each problem suggests a different remedy. Changing data distributions may require monitoring or a revised training sample. A broken feature pipeline requires a data-engineering fix. A new relationship between features and outcomes may justify retraining. If the target label itself is no longer appropriate, teams may need to redefine the task rather than improve the old model.
The main lesson is that drift is not a single error message. It is a diagnosis that requires evidence about both the environment and the model’s decisions.
Four Changes That Monitoring Teams Should Distinguish
Data drift: the inputs look different
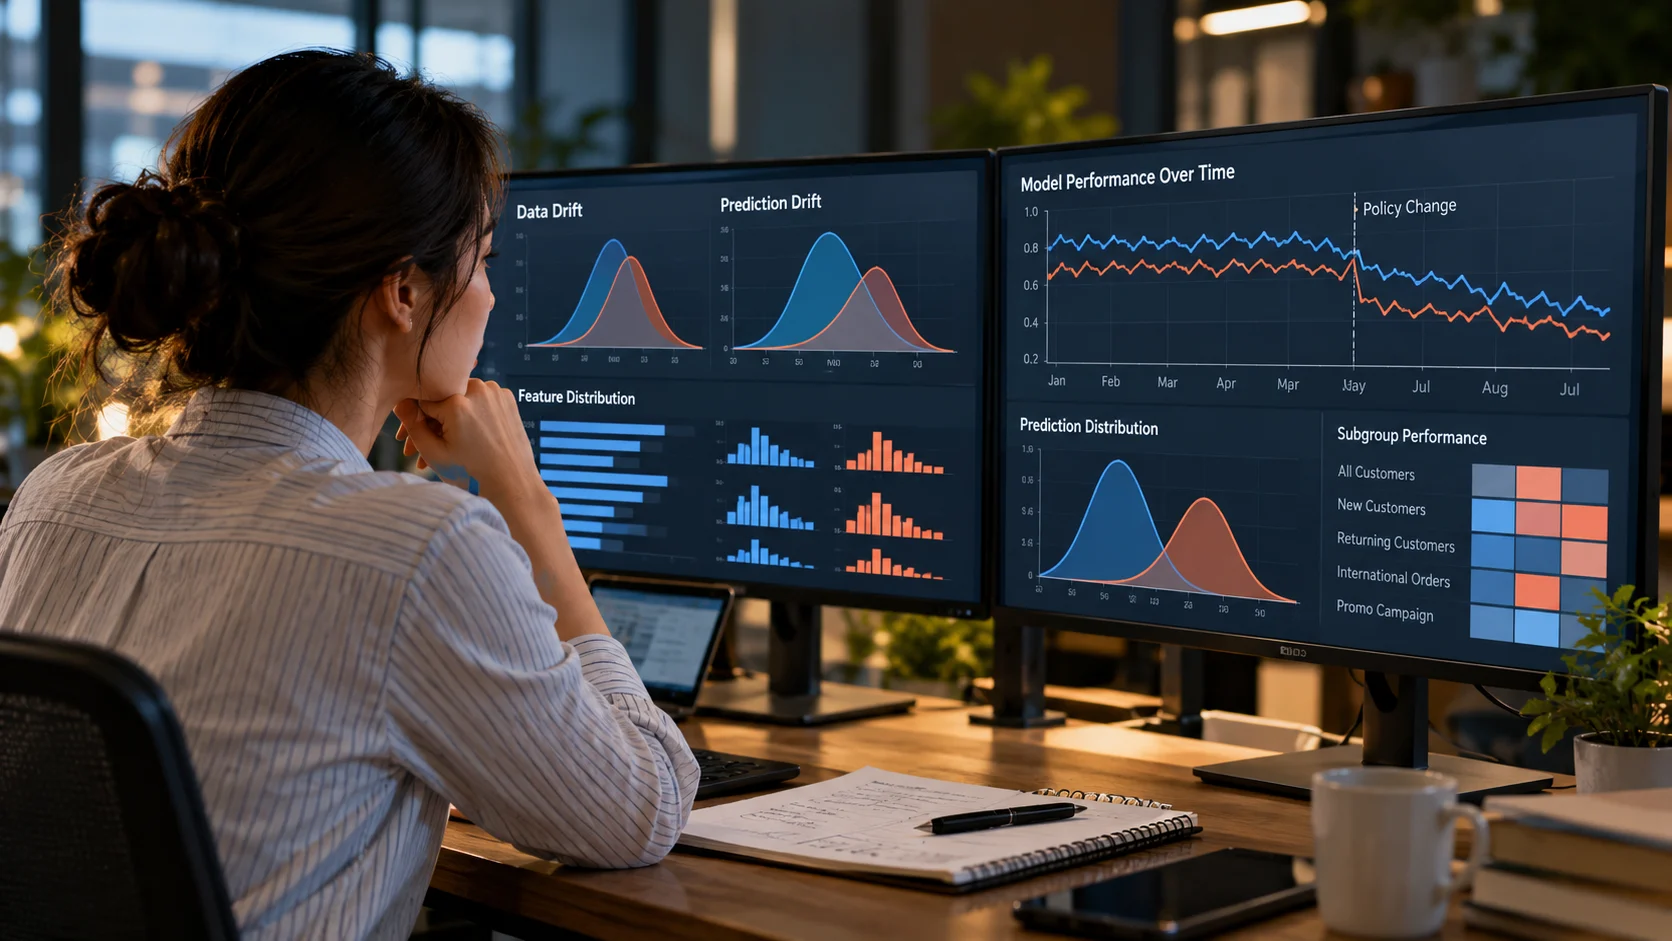
Data drift occurs when incoming feature values differ in distribution from a reference period. An online retailer may see a higher proportion of first-time buyers, a different mix of product categories, or orders originating from a new campaign. That shift can be genuine and entirely expected.
Teams may compare numeric distributions using summary statistics or appropriate distance measures, and compare categorical features using frequency tables. These measures are sensitive to sample size and reference-window choice. A statistically detectable shift in a large dataset may be too small to matter operationally. Conversely, a small but critical subgroup can deteriorate without producing a dramatic population-wide alert.
Concept drift: the relationship changes
Concept drift is more consequential for prediction quality. It arises when the mapping between available features and the correct outcome changes. Suppose late delivery once increased the chance of a return, but a retailer introduces a generous compensation policy that changes how customers respond. The same delivery delay may no longer signal the same risk.
Confirming this kind of change normally requires outcomes, not only inputs. For a returns model, true labels may take weeks to arrive. A dashboard that measures only this morning’s feature distributions cannot establish how accurately yesterday’s predictions performed.
Label shift and target-definition changes
The proportion of positive outcomes can also change. A business may have fewer returns after changing its catalog, for example. In some statistical settings this is called label shift. But practical monitoring must ask a separate question: was the outcome recorded in the same way?
If an organization starts counting exchanges as returns, historical and current target values are no longer directly comparable. A model may appear to degrade even though its behavior has not changed. This is a data-contract or target-definition problem, and retraining alone will not make the measurement meaningful.
Prediction drift: the scores move
Model scores can be monitored before verified outcomes are available. An unusual surge in high-risk predictions might indicate changed customers, changed features, a software release, or a genuine increase in risk. Score drift is therefore a useful early-warning signal, but it is not proof that predictions are wrong. Inspect it alongside input changes and recent system deployments.
Worked Example: A Retailer Changes Its Returns Policy
Imagine a retailer using a model to flag orders that may require extra customer support. The original model was trained before a significant return-policy update. The team sees the following fictional pattern:
Period Operational change Verified return rate What to investigate
Training period Original policy and customer mix 8% Establish trusted baseline definitions
First week after change New final-sale conditions introduced 5% Check outcome labels and new policy fields
Fifth week after change Customer behavior has adapted 4% Measure predictive accuracy on confirmed outcomes
A falling return rate might be good for the business. It does not tell the analyst whether the model now makes better predictions. The model might overpredict returns because the historical relationship has changed. It might also be correctly identifying the smaller group that remains likely to return an item.
The analyst should first confirm that returns are recorded consistently across the periods. Next, join past predictions with orders whose final outcomes are known. Compare error rates, precision, recall, or calibration according to what the model is used for. Then break results down by product category and acquisition channel. A model that performs adequately overall might fail badly on one new class of orders.
Do not retrain simply because the verified return rate fell. Retraining is justified only after the team has defined what failure means, shown that the current model is no longer appropriate, and demonstrated that a candidate replacement performs better on a realistic holdout.
Build a Monitoring Process Before the Next Incident
1. Save a dependable reference baseline
A baseline should include feature definitions, data types, missing-value rates, typical ranges, categorical distributions, and the time period used for training. Store the model version and target definition alongside them. Without this information, a team may compare current records with a moving reference and struggle to explain why yesterday’s alert disappeared.
Choose the baseline deliberately. For a seasonal business, comparing holiday purchases with an ordinary February week can produce misleading warnings. Depending on the use case, a seasonal reference or several comparison windows may be more informative than one historical average.
2. Validate the data pipeline before blaming the model
A surprising input trend is sometimes a software problem. Check for renamed fields, changes in units, broken joins, duplicated events, altered time zones, unexpected null values, and category labels that no longer match training conventions.
Suppose a shipping integration changes delivery time from hours to minutes, while downstream code still expects hours. A distribution-monitoring alert may look like a dramatic customer-behavior shift. The correct fix is to restore the feature contract, not to train a model on corrupted numbers.
3. Watch prediction distributions without overinterpreting them
Score distributions, high-risk classifications, and volume changes can reveal unusual behavior while the true outcomes are still unknown. These signals are valuable for triage. However, a monitor should display enough context to distinguish a change in traffic from a model malfunction.
Track the number of predictions as well as their distribution, especially when activity is irregular. A change affecting twenty cases has a different evidential weight from one observed across twenty thousand. Alert thresholds need to reflect actual incident costs and realistic response capacity.
4. Connect predictions to outcomes when labels mature
For many applications, labels arrive later than predictions. Orders may not be returned for several weeks; loan outcomes take far longer; customer churn may not be measurable until an observation window has passed.
Build a reliable join between each prediction, its model version, its input timestamp, and its eventual verified outcome. Evaluate only cases with sufficiently mature labels. If recent outcomes are incomplete, report that limitation rather than presenting optimistic metrics based on the small subset that has already resolved.
5. Examine groups that aggregate scores can hide
Overall accuracy is rarely enough. Compare results across product groups, locations, customer cohorts, traffic sources, or other segments that are relevant and legitimate to monitor. A new sales channel might represent only a small percentage of orders while accounting for many incorrect decisions.
Choose segments with enough observations to support meaningful interpretation. Very small groups produce noisy estimates. When personal attributes are involved, monitoring must also respect privacy, access rights, and applicable fairness obligations.
6. Maintain an incident record and an owner
A monitor is useful only if somebody can interpret its alerts. For each significant incident, record the alert time, affected features, model version, observed consequences, suspected root cause, response, and follow-up result.
A simple incident log prevents repeated debates about the same seasonal pattern. It also makes it possible to distinguish genuine improvements from alerts that were simply disabled because they became inconvenient.
Which Metrics Are Useful for Drift Detection?
Different metrics answer different questions, so a dashboard should not merge them into one unexplained “health” score.
Metric family Question it helps answer Important limitation
Input distributions Does live data resemble the reference population? Change does not prove worse predictions
Missing-value and schema checks Is the pipeline still producing valid features? Valid data can still be unrepresentative
Prediction-score distributions Has model behavior shifted? Scores are not verified outcomes
Accuracy, precision, recall, or error cost Is the model making useful predictions? Requires mature, representative labels
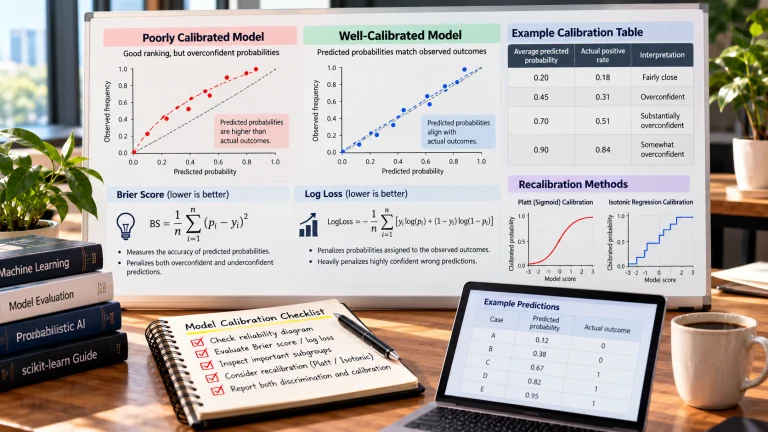
Calibration Do predicted probabilities align with observed frequencies? Depends on enough outcome observations
Segment-level performance Is deterioration concentrated in one group? Small samples require caution
Choose metrics according to the decision. A high recall rate may matter for safety screening, while false-positive costs may dominate a marketing campaign. Calibration matters when probability estimates drive thresholds or resource allocation. Evaluation should reflect the real cost of mistakes rather than the most visually appealing chart.
When Should You Retrain a Drifting Model?
Retraining is appropriate when new training information can plausibly improve the model and a fair comparison supports that conclusion. Start by verifying the problem. Is the target still defined consistently? Is the live feature pipeline valid? Have customers or policies changed in ways the model should learn? Are verified outcomes available?
If the inputs are corrupted, repair the pipeline first. If only the score threshold is no longer appropriate, recalibration or a threshold adjustment might be sufficient. If a feature has become unavailable, revisit feature engineering. If the underlying predictive relationship has changed, an updated training window or model architecture may be necessary.
Compare candidate models with the current one using a time-aware holdout that reflects deployment conditions. Avoid training on information that would not have been available when each prediction was made. Test critical subgroups and operational costs, not only average benchmark accuracy. Keep the ability to roll back if the new model performs worse once deployed.
Blindly scheduling retraining every week can be harmful. It may incorporate faulty labels, chase noise, or erase useful historical signal. A retraining calendar is a maintenance tool, not evidence that retraining is beneficial.
Common Mistakes That Produce Misleading Drift Alerts
One mistake is using an arbitrary threshold for every feature. A large dataset will make tiny shifts look statistically notable, while an important smaller segment might receive too little attention. A second mistake is ignoring seasonality and marketing events; those changes may be predictable rather than pathological.
A third mistake is measuring performance on incomplete labels. For example, orders returned rapidly may be overrepresented in the first week, creating a biased early estimate. A fourth mistake is assuming that fixing the statistical metric also fixes the underlying business decision. A model can improve average accuracy while creating more costly false positives for a particular workflow.
Finally, avoid treating a drift dashboard as a substitute for ownership. Alerts require investigation, documentation, and a decision about action. If nobody is responsible for the response, the dashboard may create confidence without control.
Frequently Asked Questions
Is AI model drift inevitable?
Real-world conditions often change, but not every change damages performance. Models built for stable, well-defined tasks may remain useful for long periods. Monitoring is valuable because it verifies that stability rather than assuming it.
Does data drift always mean retraining is needed?
No. Data drift is a signal to investigate. The new population may be harmless, expected, or even associated with better business outcomes. Retrain only after establishing a task-relevant problem and verifying that an alternative improves it.
Can I detect drift when no ground-truth labels exist yet?
You can monitor input distributions, data quality, model scores, and operational behavior. Those signals can support early investigation, but they cannot by themselves establish accuracy on unknown outcomes.
What is the difference between model drift and a data pipeline error?
Model drift concerns changes that affect the applicability or performance of a model in its environment. A pipeline error changes the information the model receives because processing is broken or inconsistent. A pipeline error can create drift-like symptoms, so check data contracts before retraining.
Conclusion
AI model drift is best understood as a monitoring and diagnosis problem, not a command to retrain whenever a statistic moves. Data distributions, target relationships, prediction scores, and confirmed outcomes tell different parts of the story. Start with reliable baselines and valid input data, connect predictions to their eventual outcomes, and investigate performance by meaningful segment. The right response is the one that restores a useful decision—not merely the one that makes an alert disappear.
Further Reading on ByteScope
AI Benchmarks Explained
How AI Training Data Works
AI Inference Explained
Sources and Further Reading
Google Cloud: Model Monitoring Overview
scikit-learn: Model Evaluation
This article explains general principles rather than claiming that ByteScope has independently tested a particular monitoring platform.