Modern organizations rarely suffer from a complete absence of data.
They have analytics dashboards, spreadsheets, customer records, transaction histories,
application logs, website metrics, operational sensors, employee reports, support tickets,
marketing data, AI-generated summaries, and notifications from dozens of digital systems.
Every new platform produces more information.
Every automation produces more events.
Every connected system creates another stream of activity.
The result should be better decisions.
Instead, something strange often happens.
Teams spend more time looking at information while becoming less certain about what
deserves attention.
Dashboards contain dozens of metrics.
Email inboxes fill with alerts.
Reports become longer.
Managers ask for additional charts because the existing charts do not answer the question.
Employees download data into spreadsheets so they can interpret it manually.
The organization has more visibility but not necessarily more clarity.
This is the difference between data exhaust and a
decision signal.
Data exhaust is the large volume of digital information produced as a by-product of
processes, systems, transactions, devices, and user activity.
A decision signal is different.
It is information that has enough relevance, context, timing, and ownership to influence
what someone should do next.
Digital innovation therefore does not create value merely by collecting more data.
It creates value when information becomes useful enough to change action.
More Data Can Create Less Clarity
Data collection has become remarkably easy.
A website can record every click.
A software platform can record every login.
A machine can produce sensor measurements every second.
A customer platform can track every interaction.
A digital advertisement can generate dozens of performance indicators.
Technically, this creates visibility.
Operationally, it can create overload.
The central problem is that not every measurable event deserves human attention.
A system that reports everything equally forces people to perform the filtering themselves.
This is the digital equivalent of an alarm panel where every light is flashing.
If everything looks important, nothing looks important.
The Difference Between Data, Information, Signal, and Action
These terms are often treated as though they mean the same thing.
They do not.
Data
A raw observation.
For example:
Response time: 840 milliseconds.
Information
Data with some interpretation.
For example:
Average response time increased from 420 to 840 milliseconds.
Signal
Information that may require attention.
For example:
Response time doubled during checkout and is exceeding the normal operating
range.
Decision
A judgment about what should happen.
For example:
Investigate the payment-service dependency before the next traffic peak.
Action
The actual intervention.
An engineer checks the dependency, changes configuration, or escalates the issue.
The value chain is therefore not:
More data → better decisions.
It is closer to:
Data → Context → Signal → Decision → Action → Outcome.
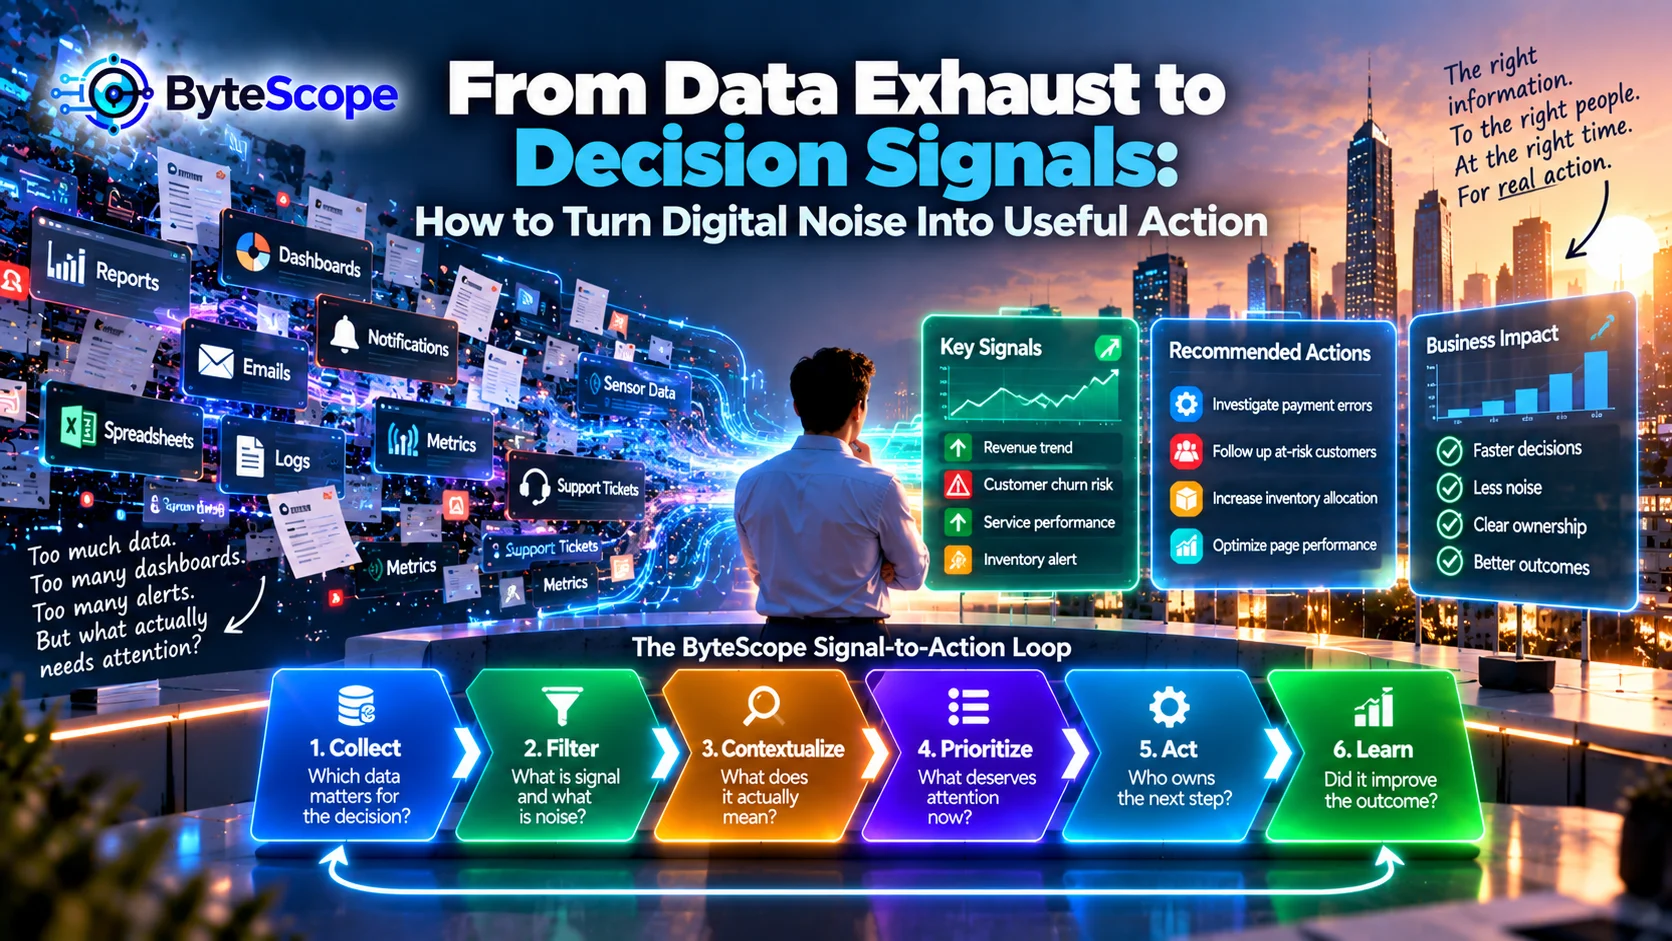
The ByteScope Signal-to-Action Loop
To make this process practical, ByteScope uses a six-stage framework:
Collect → Filter → Contextualize → Prioritize → Act → Learn.
Each stage removes some uncertainty.
The objective is not to make every piece of data actionable.
The objective is to prevent important signals from disappearing inside digital noise.
1. Collect: Start With the Decision, Not the Data
Organizations often begin analytics projects by asking:
“What data can we collect?”
A better starting question is:
“Which decision are we trying to improve?”
Suppose a retailer wants to reduce abandoned customer orders.
Relevant information may include checkout errors, page response time, payment failures,
inventory availability, and abandonment stages.
The number of social media impressions from last week may be interesting, but it probably
does not help diagnose checkout abandonment.
Starting with the decision prevents the data environment from becoming an uncontrolled
collection project.
The “So What?” Test
For every important metric, ask:
“If this number changes, what would we do differently?”
If nobody can answer, the metric may still be useful for historical analysis, but it
probably should not occupy prominent attention on an operational dashboard.
Consider:
Total website visitors.
Interesting.
But does an increase from 80,000 to 90,000 require an action?
Maybe not.
Now consider:
Checkout completion dropped from the normal range while payment errors increased.
That information has a clearer relationship to action.
Collecting Everything Creates Its Own Cost
More data means more storage, processing, integration, governance, security, interpretation,
and maintenance.
Organizations can therefore create a form of information debt.
Datasets accumulate because somebody once thought they might be useful.
Dashboards remain because nobody wants to remove them.
Reports continue being generated because they have always been generated.
Eventually, nobody is entirely sure which information still matters.
This resembles the pattern discussed in
Innovation Debt: The Hidden Cost of Moving Fast With Digital Technology
.
Digital complexity can accumulate not only through applications and integrations, but also
through information that nobody is willing to retire.
2. Filter: Separate Useful Variation From Noise
Digital systems produce constant variation.
Website traffic changes throughout the day.
Customer demand changes by season.
Network response time fluctuates.
Sales differ by location.
Support volume rises after major product changes.
Not every change is a problem.
A useful signal requires filtering normal variation from unusual behavior.
Alerts Should Be Rare Enough to Matter
One of the fastest ways to destroy a monitoring system is to create too many alerts.
At first, every warning receives attention.
Then employees realize that most warnings require no action.
They begin ignoring them.
Eventually, a genuinely important alert arrives and looks identical to the irrelevant
ones.
This is alert fatigue.
A good alert should ideally indicate:
- something unusual happened;
- the event matters;
- someone knows what should happen next.
Static Thresholds Are Not Always Enough
A threshold might say:
Alert when daily orders fall below 500.
That works only if 500 has the same meaning every day.
What if weekends normally receive 350 orders?
What if December normally receives 1,200?
The number needs context.
Sometimes a useful signal is based not on an absolute value but on deviation from expected
behavior.
For example:
Orders are 28 percent below the normal level for this time and day.
That is a much stronger signal.
Filtering at the Edge Can Reduce Data Exhaust
In connected environments, filtering does not always need to happen centrally.
A machine may produce thousands of sensor readings.
Instead of sending every reading into the cloud, a local system can summarize normal
behavior and transmit richer information when an anomaly occurs.
ByteScope’s
From Cloud to Edge: Where Digital Innovation Actually Happens
explored this pattern.
The principle also applies outside industrial systems:
move the information that deserves attention, not necessarily every raw event.
3. Contextualize: A Number Without Context Is Often Misleading
A metric rarely speaks for itself.
Suppose revenue increased by 12 percent.
Is that good?
Possibly.
But what if marketing spending increased by 40 percent?
What if the business usually grows 20 percent during this season?
What if order volume increased while average margin collapsed?
The meaning of a number depends on context.
Useful Context Comes From Comparison
A metric becomes easier to interpret when compared with:
- a previous period;
- a normal operating range;
- a target;
- a similar location;
- a customer segment;
- a process stage;
- another related metric.
Instead of:
Support backlog: 640.
show:
Support backlog: 640, up 38 percent from the weekly normal range, concentrated in
billing requests.
Now the metric begins behaving like a signal.
The Importance of Shared Definitions
Context also depends on language.
Imagine a dashboard showing “Active Customers.”
Marketing defines active as someone who opened an email during the previous 90 days.
Sales defines active as an account with an open opportunity.
Finance defines active as a customer who generated revenue within the past year.
The same label now describes three different populations.
The interoperability issues discussed in
Interoperability Is the Real Superpower
apply directly to analytics.
Systems cannot produce reliable signals if important concepts have inconsistent meaning.
4. Prioritize: Not Every Signal Deserves Immediate Action
After filtering and context, organizations may still have more signals than they can act on.
Prioritization is therefore essential.
One useful approach is to consider:
- impact;
- urgency;
- confidence;
- reversibility.
Impact
How significant are the consequences?
Urgency
How quickly must something happen?
Confidence
How certain are we that the signal represents a real problem rather than noise?
Reversibility
If we respond and turn out to be wrong, can the action be easily undone?
These dimensions help distinguish:
interesting information
from
information that deserves intervention.
The Red Dashboard Problem
Many dashboards use red, yellow, and green indicators.
The model is intuitive.
But poorly designed dashboards can quickly become dominated by red indicators.
Users learn that red does not necessarily mean urgent.
It simply means the metric missed an arbitrary threshold.
A useful priority indicator should represent consequence, not decoration.
Build a Decision Queue, Not an Information Wall
A traditional dashboard often shows information arranged by metric category.
A decision-oriented dashboard can organize information differently.
For example:
- Needs action now
- Needs review today
- Watch for change
- Normal operation
This changes the user question from:
“What does the data say?”
to:
“What requires my attention?”
5. Act: A Signal Without Ownership Becomes Another Dashboard
Organizations can identify a meaningful signal and still fail to create value.
Why?
Because nobody owns the next action.
A dashboard displays rising customer cancellations.
Marketing assumes customer success is investigating.
Customer success assumes product owns the issue.
Product assumes analytics will provide more detail.
Everyone sees the same signal.
Nobody acts.
Every Critical Signal Needs a Decision Owner
For important operational information, define:
- who receives the signal;
- what they are expected to assess;
- which actions they are authorized to take;
- when escalation is required;
- how the action is recorded.
This is where analytics becomes workflow.
Data does not create value until it influences something people or systems actually do.
Automate the Response Only When the Decision Is Predictable
Some signals can trigger automatic action.
For example:
If a routine service becomes temporarily unavailable, traffic may be automatically directed
to another healthy instance.
If inventory falls below a clearly defined level, a replenishment workflow may begin.
Other signals require judgment.
A drop in customer satisfaction may have many possible causes.
An unusual sales pattern may represent a problem or an opportunity.
ByteScope’s
When Automation Helps—and When It Hurts
provides a useful principle:
automate predictable decisions while preserving human judgment where context and
consequences matter.
The Best Dashboard May Sometimes Be No Dashboard
If a signal always leads to the same safe action, users may not need to stare at a dashboard
waiting for it.
The system may be able to handle the event automatically and notify a human only when an
exception occurs.
This is an important evolution in digital operations.
Instead of asking employees to watch more information, good systems can reduce the amount
of information that requires attention.
6. Learn: Did Acting on the Signal Improve Anything?
The final stage is feedback.
Suppose the system detects rising support volume.
The team investigates and updates a confusing product workflow.
What happens next?
Did support volume return to normal?
Did the intervention solve the problem?
Was the original signal useful?
Should the alert threshold change?
Without this feedback, the organization cannot improve its signal system.
Signals Need Performance Reviews Too
Organizations commonly evaluate employees, projects, and products.
They rarely evaluate alerts and dashboards themselves.
Useful questions include:
- How often did this alert lead to meaningful action?
- How many alerts were false positives?
- Which signals were consistently ignored?
- Which important problems were not detected?
- Which dashboard metrics never influenced a decision?
If a metric has not influenced any action for a year, perhaps it should move to historical
reporting rather than remain on the main dashboard.
Measure the Decision System, Not Just the Data
The principles in
Digital Innovation That Pays Off
apply directly here.
A data system should be evaluated through outcomes.
Possible measures include:
- time from signal to action;
- percentage of alerts requiring intervention;
- false-positive rate;
- number of incidents detected before customer impact;
- reduction in manual monitoring;
- improvement after intervention;
- number of unused dashboard metrics retired.
The Dashboard Trap
Dashboards have become one of the most recognizable symbols of digital transformation.
They can be extremely useful.
They can also create the illusion of control.
A dashboard may show twenty graphs, twelve KPIs, four filters, three forecasts, and live
updates.
The interface looks sophisticated.
But ask the user:
“What do you do differently because of this dashboard?”
If the answer is unclear, the dashboard may be reporting rather than supporting decisions.
A Dashboard Should Have a Job
Different dashboards serve different purposes.
Monitoring Dashboard
Answers:
Is the system operating normally?
Diagnostic Dashboard
Answers:
Why did something change?
Strategic Dashboard
Answers:
Are we moving toward the intended outcome?
Operational Queue
Answers:
What needs attention next?
Trying to make one dashboard serve every audience usually creates clutter.
Executives and Operators Need Different Signals
A chief executive may need to know that customer retention is declining.
A frontline customer-success manager may need to know which customer accounts show specific
warning patterns today.
Both are looking at the same broad problem.
They require different signal resolution.
Information should match the level at which a decision can actually be made.
Data Silos Create Conflicting Signals
Suppose the sales dashboard shows strong growth.
The finance dashboard shows declining profitability.
The support dashboard shows rising complaints.
Each dashboard may be correct.
The broader signal appears only when the information is combined.
Digital decisions therefore often require cross-functional context.
This is another reason connected systems matter.
Correlation Is Not Automatically a Cause
Data can show that two things changed together.
That does not necessarily mean one caused the other.
Suppose product complaints increase after a software update.
The update may be responsible.
But perhaps the company simultaneously launched a marketing campaign that brought in many
new users unfamiliar with the product.
A decision signal should initiate investigation, not create false certainty.
AI Can Help Find Signals, but It Can Also Create More Noise
Artificial intelligence can summarize large amounts of information, identify unusual
patterns, classify messages, detect anomalies, and help users query data using natural
language.
These capabilities can reduce information overload.
But AI can also generate endless summaries, recommendations, alerts, and interpretations.
The organization may move from:
“too much raw data”
to:
“too many AI-generated insights.”
The problem remains.
The AI Insight Test
Before surfacing an AI-generated recommendation, ask:
- Is it relevant to a real decision?
- Is the supporting evidence available?
- How confident should the user be?
- What could the user reasonably do next?
An insight that cannot survive these questions may be interesting but not actionable.
AI Should Compress Attention, Not Expand It
One of the most useful roles for AI in information-rich environments is reducing the amount
of material humans need to inspect.
Instead of presenting 5,000 customer comments, an AI system might identify recurring themes
and surface representative examples.
Instead of requiring managers to examine hundreds of operational events, it might highlight
the few patterns outside the expected range.
The goal is not to generate more information.
It is to make limited human attention more effective.
Decision Signals and Digital Resilience
Signal quality is especially important during disruptions.
ByteScope’s
Designing for Failure: Why Resilient Digital Systems Assume Things Will Break
discussed the importance of detecting failures early and preventing them from spreading.
Detection depends on useful signals.
If monitoring produces thousands of irrelevant alerts, critical failure may be hidden.
Resilience therefore depends not merely on collecting operational data but on distinguishing
normal variation from conditions that require intervention.
Decision Signals and the Last Mile
The last-mile principles discussed in
The Last-Mile Problem of Digital Transformation
also apply to analytics.
A signal is only useful if it reaches the person who can act on it in a form they can
understand.
A frontline employee does not need a sophisticated analytics interface if the real decision
is simply:
Contact these three customers today.
The best analytics experience may therefore hide much of the analytics.
A Practical Example: Customer Churn
Imagine a subscription business trying to reduce customer cancellations.
The company collects:
- login frequency;
- feature usage;
- support requests;
- billing history;
- survey responses;
- contract information.
Showing every variable to a customer-success employee may create overload.
A decision-signal system might instead identify customers whose recent behavior differs
meaningfully from their previous pattern.
The employee receives:
Seven high-value accounts show significant engagement decline and unresolved
support activity.
Now the information is connected to an action.
A Practical Example: Ecommerce Operations
An ecommerce company may monitor:
- traffic;
- conversion;
- cart abandonment;
- payment errors;
- page performance;
- inventory;
- refunds;
- shipping delays.
A manager does not need an alert every time one metric moves.
A stronger signal might be:
Mobile checkout conversion is 22 percent below its normal range while payment
failure rate has doubled since the latest deployment.
This combines magnitude, context, segmentation, and a possible investigation path.
A Practical Example: Manufacturing
A factory may collect thousands of measurements from equipment.
Raw data is useful for detailed analysis.
Operators need something different.
They need to know:
Which machine is behaving unusually?
How severe is the deviation?
Does it require immediate intervention?
What evidence supports the warning?
This is the movement from sensor exhaust to operational signal.
A Practical Example: Small Business
A small online business may not need advanced AI analytics.
It may already have enough data in its ecommerce platform, accounting software, website
analytics, and customer inbox.
The problem may simply be deciding which numbers deserve weekly attention.
A useful small-business signal board might contain:
- orders;
- conversion rate;
- repeat customers;
- refund rate;
- unresolved customer issues;
- cash collected.
Five meaningful indicators can be more useful than fifty metrics nobody acts on.
The Decision Signal Audit
Choose one important dashboard, report, or analytics workflow.
For each metric, ask:
- Which decision does this support?
- What is considered normal?
- What change would deserve attention?
- Who owns the response?
- What action could follow?
- How will we know whether the action worked?
If several metrics fail this test, the dashboard may contain more information than decision
support.
The 30-Day No-Action Test
Look at the metrics on a frequently used dashboard.
Ask:
Which of these metrics influenced an actual decision during the past 30 days?
Metrics that never influenced action may still deserve historical storage or periodic
reporting.
But they may not deserve prominent dashboard space.
Attention is a limited resource.
The One-Screen Rule
For operational decision-making, try designing the first screen around only three questions:
- What is abnormal?
- Why might it matter?
- Who needs to act?
Deeper analysis can remain available below the surface.
The first screen should prioritize attention rather than display everything the system knows.
Five Warning Signs of Data Exhaust
- Dashboards keep growing but old metrics are rarely removed.
- Employees export dashboard data into spreadsheets before they can make decisions.
- Teams receive many alerts but routinely ignore most of them.
- Different departments report different versions of the same KPI.
- Managers ask for more data whenever a decision is unclear.
These symptoms suggest the problem may not be a shortage of information.
The problem may be information architecture.
Six Questions for Turning Data Into Action
Apply the ByteScope Signal-to-Action Loop:
- Collect: Which decision are we trying to improve?
- Filter: Which changes are meaningful rather than normal noise?
- Contextualize: What comparison makes the number understandable?
- Prioritize: Does this deserve attention now?
- Act: Who owns the next decision?
- Learn: Did the intervention improve the outcome?
The framework turns analytics into a closed loop rather than a one-way stream of reporting.
Frequently Asked Questions
What is data exhaust?
Data exhaust is the large amount of secondary data generated by digital activity,
applications, devices, transactions, and workflows. Some of it can be useful, but much of
it may not deserve immediate attention.
What is a decision signal?
A decision signal is information that has enough relevance, context, timing, and confidence
to influence a specific decision or action.
Why can having too much data be a problem?
Large volumes of information can increase storage, governance, analysis, and cognitive
burden. If important signals are not separated from ordinary noise, decision-makers may
struggle to identify what deserves attention.
What makes a dashboard useful?
A useful dashboard supports a defined audience and decision. It emphasizes relevant
exceptions, provides appropriate context, avoids unnecessary metrics, and helps users
understand what may require action.
How can organizations reduce alert fatigue?
Reduce low-value alerts, use meaningful thresholds, add context, distinguish urgency, route
alerts to clear owners, and periodically review whether alerts actually resulted in useful
intervention.
Can AI help identify decision signals?
Yes. AI can summarize information, identify patterns, detect anomalies, classify events,
and help users explore data. However, AI-generated insights still need context, evidence,
appropriate confidence, and a clear relationship to action.
Should every business use real-time analytics?
No. Real-time information is valuable when decisions must happen quickly. For slower
processes, daily, weekly, or periodic analysis may provide the same value with less
complexity.
The Bottom Line
The modern digital problem is increasingly not:
“How do we get more data?”
It is:
“How do we know what deserves attention?”
Organizations can collect millions of events and still miss the one signal that matters.
They can build sophisticated dashboards and still rely on employees to manually interpret
what should happen next.
They can deploy AI to generate more insights and accidentally create another layer of
information overload.
The ByteScope Signal-to-Action Loop offers a different approach:
Collect → Filter → Contextualize → Prioritize → Act → Learn.
Collect information around a real decision.
Filter normal noise from meaningful change.
Add enough context to understand what the change means.
Prioritize signals according to impact and urgency.
Connect important information to someone capable of acting.
Then learn whether the intervention actually improved the result.
The objective is not a dashboard with more charts.
It is not an analytics platform with more metrics.
It is not an AI assistant producing more summaries.
The objective is a digital system that knows when information should remain in the
background and when it deserves human attention.
That distinction becomes increasingly valuable as organizations generate more information
than any person could realistically inspect.
The future of data-driven work will therefore depend less on who can collect the most data.
It will depend on who can turn the right data into the right signal, place that signal in
front of the right person, and connect it to the right action at the right time.
Because data itself does not make decisions better.
Useful signals do.